Subjects:
- Video of engine running
- Measurement results
- Graphs
- Scatter Chart
Video of the engine running:
In the previous stage, the engine was made functional on the MegaSquirt engine management system. Using the TunerStudio program, the MegaSquirt ECU has been programmed and set up correctly. This section shows a video shot after the settings were completed. The video is divided into three parts:
- starting and idling;
- idling and displaying parts such as the modified intake manifold and ignition coil;
- increased speed.
Measurement results:
The video shows that the engine starts well, idles nicely and the speed can be increased to 3000 rpm without any problems. To check whether the motor functions properly on the installed motor management system, it is important to “log” all sensor values and actuator controls. This provides insight into whether the engine management system functions correctly under different operating conditions. That is why it was decided to expand the existing “TunerStudio” program with a software package that makes logging possible.
The results obtained are summarized in this chapter and are shown by means of graphs and scatterplots. These are formed by the log function in TunerStudio. After all adjustments were made, the engine ran for several minutes. This completes the entire warm-up phase, the engine has run at idle for a few minutes and the speed has been increased to 3000 rpm for a few minutes.
Graphs:
Setup with TunerStudio is done with live data; the gauges on the dashboard indicate the current value. There is also a possibility to log the data. A log contains information from the sensors and actuators that have been stored over a certain period of time. It is therefore possible to look back to assess the measurement results. This provides insight into whether the data is being processed properly and whether the engine is functioning properly.
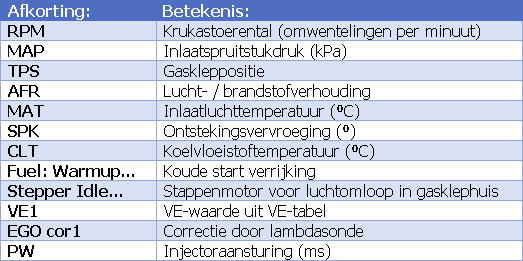
The images below show the measurement results recorded during the test run. The abbreviations are explained in the table.
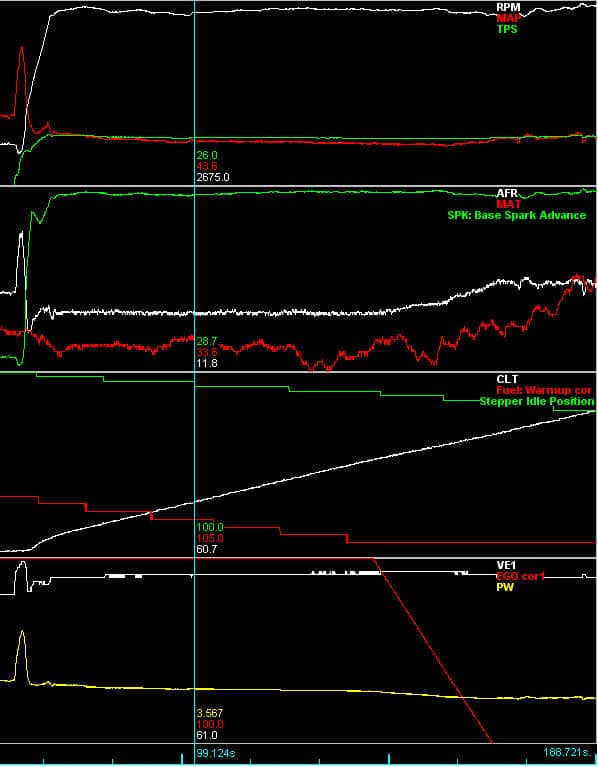
The measurement results are divided over four screens that have the same time course. The vertical, blue line serves as a cursor that moves across the screen from left to right. The top screen shows the crankshaft speed, the vacuum in the intake manifold and the throttle position. The speed increases from idle (400 rpm) to 2675 rpm. The time between opening the throttle and increasing the RPM can be seen from the negative dip in the RPM line. At that moment the negative pressure decreases (peak) and the value of the throttle position sensor increases. The value of the throttle position sensor is used to determine the acceleration gain; acceleration requires a richer mixture for a short time.
The AFR is visible in the second screen. At the point where the cursor is, the AFR is 11,8, so the mixture is rich. The intake air temperature initially fluctuates around 20⁰C, but later rises to 33,6⁰C. The green line indicates ignition advance; during the constant speed of about 2500 – 2675 rpm, the ignition advances around 28,7 to 30,0 degrees.
The third screen shows the increasing coolant temperature. This lowers the cold start enrichment and closes the stepper motor.
The bottom screen shows the volumetric efficiency (filling degree), which is 61% at the cursor. The lambda sensor correction and the injector control are also shown. The injector is actuated at the cursor location for 3,567 milliseconds. This is the actual injection time.
Following are the measurement results, which were recorded a few minutes later.
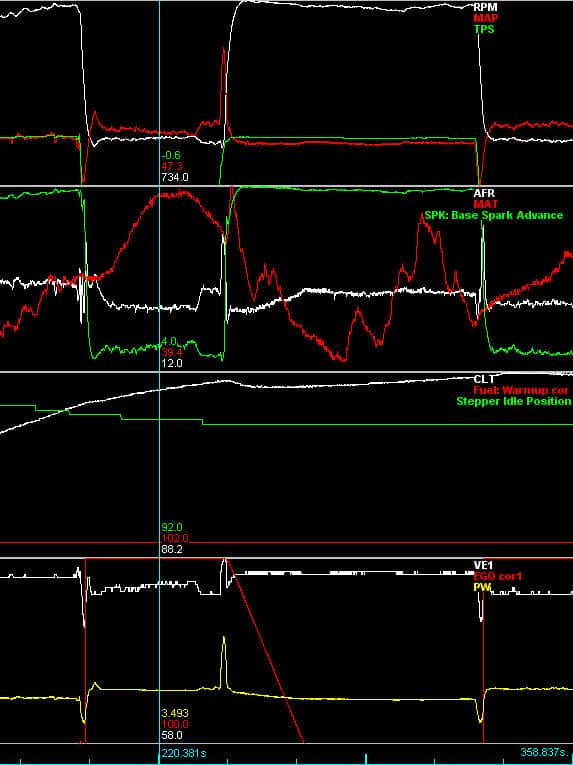
The following figure shows the measurement results of the situation where the speed decreases from 2675 rpm to the idle speed of 734 rpm and then increases again. The moment the speed drops, the acceleration enrichment stops; the TPS registers that the throttle is back in its starting position. Closing the gas valve does result in a large underpressure in the intake manifold for a while. This can be seen from the negative dip in the MAP value. When the gas valve is opened, the negative pressure drops again; this increases the MAP value for a few milliseconds.
The ignition advance has dropped from 28,7 to about 4 degrees BDC at idling.
When a temperature of 90⁰C is reached, the stepper motor has reached its maximum position; here the idle control valve is completely closed.
The decreasing and increasing speed also has an effect on the injection time; during deceleration, the injection time drops to 1,3 ms (not shown in the graph). During the increase of the speed, the actuation time is briefly increased to 7 ms. At a constant, increased speed, the injection time decreases again to approximately 3,5 ms.
Scatter Chart:
The entire cycle is shown in the image in a so-called “scatterplot”, translated into Dutch as “scatter plot”. There are two scatter charts displayed side by side, with the total progression in graph form below.
Clicking anywhere on the chart displays a circle in both charts. Clicking on different areas in the chart shows a different location in the scatter charts.
In this scatter diagram, the left diagram shows the MAP value in relation to the crankshaft speed. The colored bar to the right of the diagram indicates the AFR.
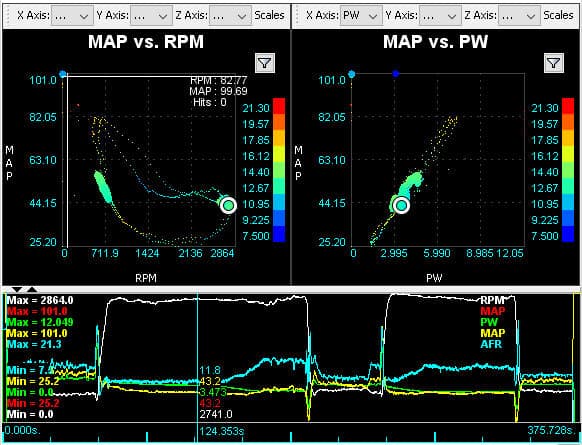
In the left diagram, the AFR is approximately 12,67. That means the mixture is rich at that point. This can be explained in view of the increased speed at a low coolant temperature (see the course of the coolant temperature in figure 46). It can also be seen that the AFR at the top left is between 17,85 and 19,57; this is during deceleration where no fuel is injected and the mixture is lean.
The right-hand diagram in Figure 48 shows the MAP value in relation to the fuel injection. Here you can see the work area.
The project has been successfully completed with the positive outcome of the measurement results.