Topics:
- Comparison of theoretical and actual work process
- Indicator diagram
- Pressure progression during the four-stroke cycle of a gasoline engine
- Pressure progression during the four-stroke cycle of a diesel engine
- Pressure progression under varying operating conditions
- Flow loss
- Effect of ignition timing on indicator diagram
- Pressure progression in the p-α diagram
- Peak gas pressure
- Average gas pressure
Comparison of theoretical and actual work process:
In a work process for a gasoline or diesel engine, we deal with a PV diagram (P = pressure, V = volume), which indicates the relationship between pressure and volume in the four-stroke cycle. More information about this can be found on the page: Seiliger process.
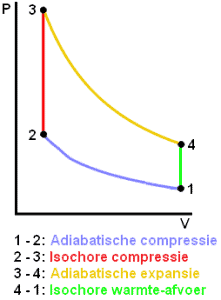
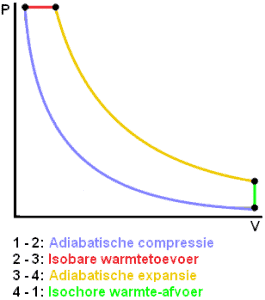
The theoretical cycle process takes place in an ideal engine, where no residual gases or losses are present. In reality, the theoretical work process differs from the actual work process due to the following discrepancies:
- the cylinder contains not only fresh charge but also residual gas from the previous work cycle;
- incomplete combustion of the fuel;
- combustion does not occur precisely at constant volume or constant pressure;
- heat exchange between the gas and the cylinder wall;
- during the work exchange, flow losses occur;
- there is always (minimal) gas leakage along the piston rings;
- the specific heat changes with pressure and temperature, affecting combustion.
The course of the actual work process is recorded with the indicator diagram.
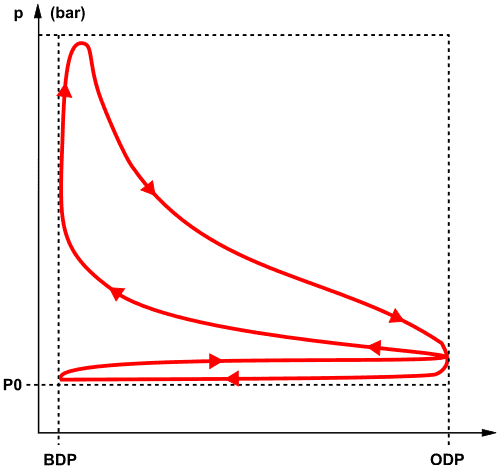
Indicator diagram:
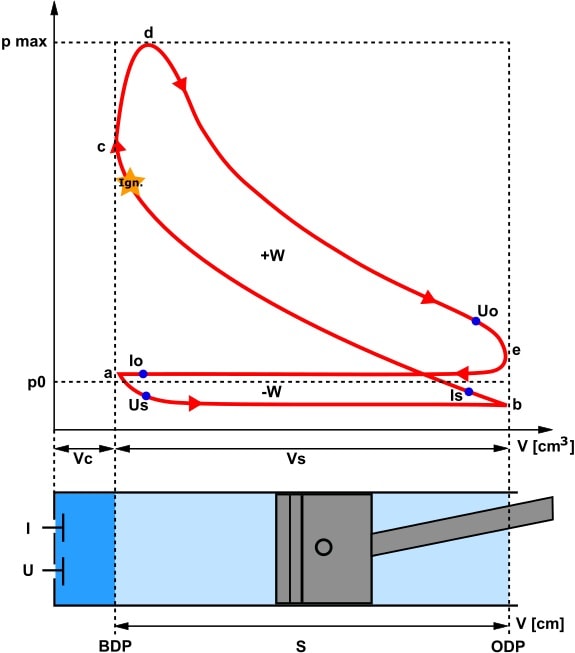
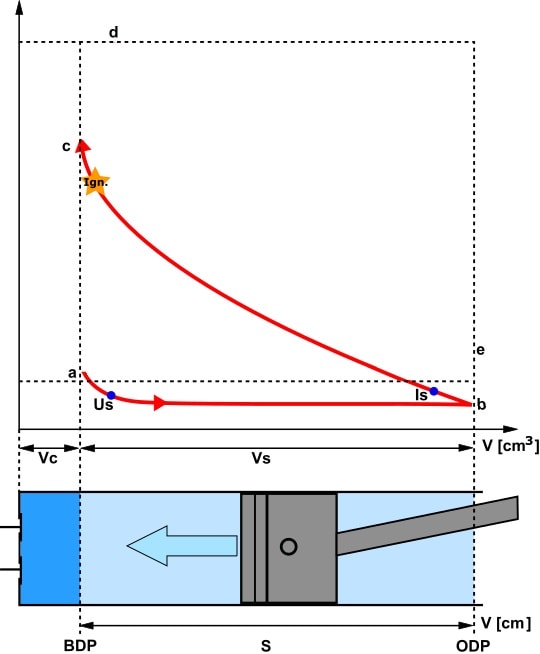
The indicator diagram displays the gas pressure in the cylinder (above the piston) during two crankshaft revolutions. The diagram is established during a pressure measurement that occurred in the cylinder.
The depicted indicator diagram is of a gasoline engine. The red line indicates the pressure progression relative to the piston stroke. In an actual measurement, one obtains a value at p Max. We will go into this later. Below the diagram is a cylinder with a piston within. The letters Vs and Vc represent the stroke volume and compression volume, respectively.
Here is a list of abbreviations used in the image:
- p0: atmospheric air pressure;
- pmax: maximum pressure in cylinder;
- S: piston stroke;
- Vs: stroke volume;
- Vc: compression volume;
- W: work (+ positive and – negative);
- Ign: ignition moment;
- Io: intake valve opens;
- Us: exhaust valve closes;
- Is: intake valve closes;
- Uo: exhaust valve opens
Pressure progression during the four-stroke cycle of a gasoline engine:
We can observe the indicator diagram in four different situations:
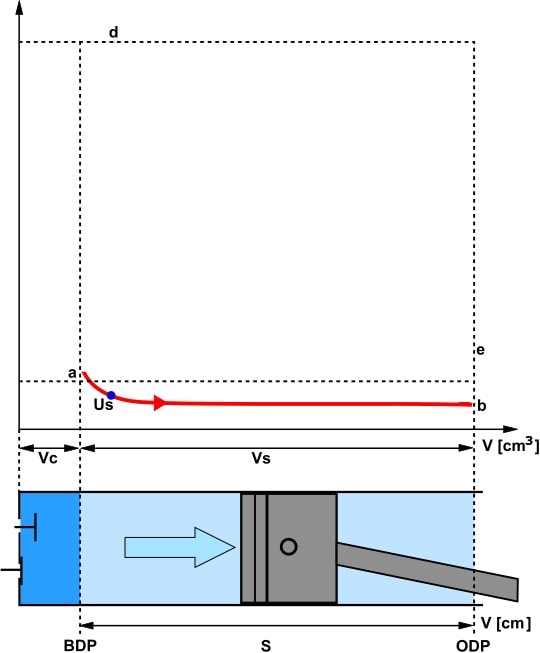
- Intake stroke: the piston moves from TDC to BDC and draws air inward. The volume increases as the space above the piston becomes larger.
The pressure remains constant*. The red line in the indicator diagram runs from a to b; - Compression stroke: the piston moves upward and compresses the air. The air volume decreases while the pressure increases. The red line demonstrates this between points b and c. At the end of the compression stroke, ignition occurs;
- Power stroke: after the spark plug ignites, it takes some time before the mixture is fully burned. This process is observed between points c and d. The force released with ignition pushes the piston downward. The volume increases and the pressure decreases. This is seen between letters d and e;
- Exhaust stroke: the exhaust valve opens, and the piston expels the exhaust gases. The volume decreases, the pressure remains constant (e to a).
Manufacturers of hybrid vehicles increasingly apply the Atkinson-Miller cycle to reduce mechanical resistance during the compression stroke. This is reflected in the upward slope of the compression stroke in the indicator diagram.
*In the explanation, we refer to constant pressure during the intake stroke. This is partly true. During the intake stroke, piston acceleration is maximal at about 60 degrees after TDC. The incoming air cannot keep up with the piston. At this point, the maximum vacuum of approximately -0.2 bar occurs. Then the cylinder pressure rises again. The mass inertia of the incoming air ensures that air continues to flow into the cylinder while the piston is already moving up. The magnitude of the vacuum depends on the throttle position and engine speed. A more closed throttle provides a greater vacuum at a constant engine speed. We have disregarded the increased vacuum during peak piston acceleration in the text and images above.
Pressure progression during the four-stroke cycle of a diesel engine:
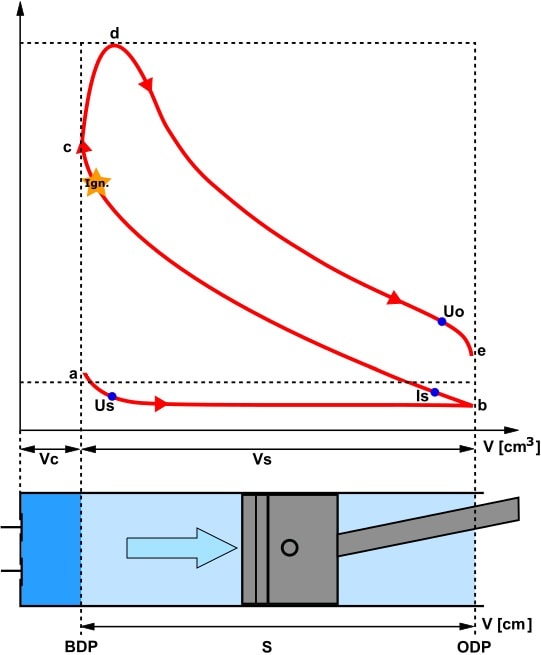
Here we see an indicator diagram of a diesel engine.
- Intake stroke: the piston moves from TDC to BDC and draws in air (if the engine is equipped with forced induction);
- Compression stroke: the piston moves toward TDC. The air is compressed, and the temperature rises to more than 100 degrees Celsius due to increased pressure. At the end of the compression stroke, diesel fuel is injected. The fuel injection begins 5 to 10 degrees before TDC and ends between 10 and 15 degrees after TDC;
- Power stroke: because diesel fuel is injected at the end of the compression stroke, it begins to burn while the pressure remains constant. The pressure in the (nearly) horizontal part remains constant, while the volume increases.
The isobaric heat dissipation from the theoretical cycle process is observed in the power stroke.
As with the gasoline engine, we see that the exhaust valve opens before the piston reaches TDC. Valve overlap also occurs because the intake valve opens earlier than the exhaust valve closes.
Pressure progression under varying operating conditions:
Besides the engine properties determining the indicator diagram, the operating conditions (i.e., engine load) also influence it. A high pressure above the piston is not always present or necessary.
The three indicator diagrams below show the pressure progression in relation to the crankshaft degrees. The diagrams are recorded under the following conditions:
- part load: 3/4 load at n = 4200 rpm;
- full load: at n = 2500 rpm;
- engine braking: at n = 6000 rpm with a closed throttle.
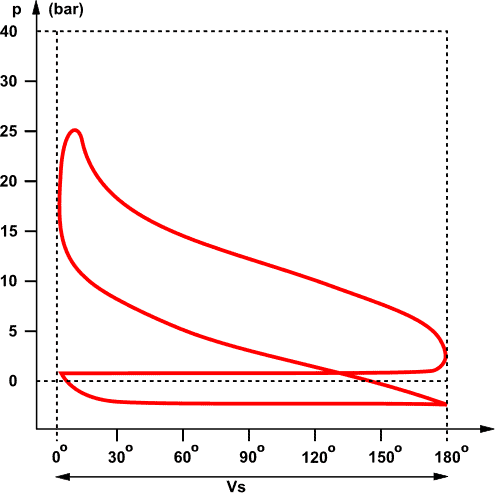
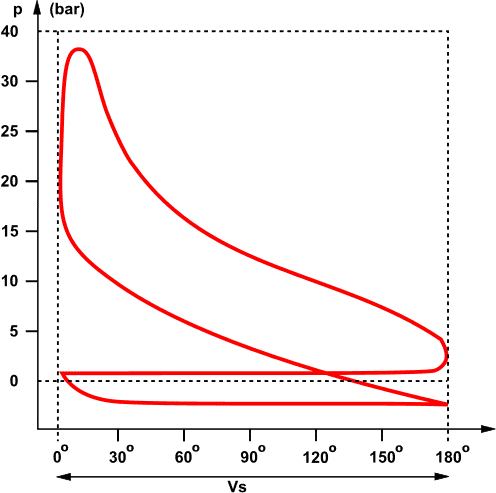
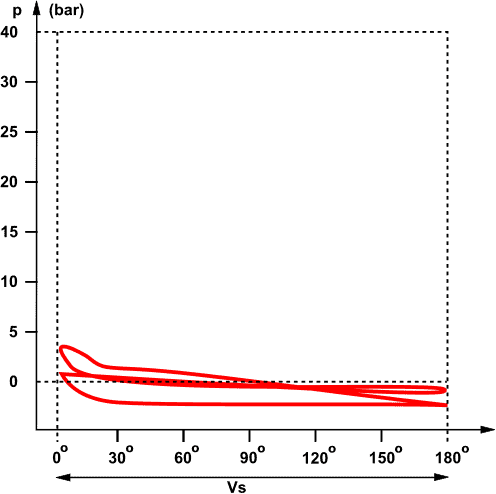
We see differences in the maximum gas pressure in the cylinder between part load and full load. During “engine braking,” the throttle valve is closed, and there is a high vacuum in the intake tract and cylinder. As a result, the compression pressure is no higher than 3 to 4 bar.
Flow loss:
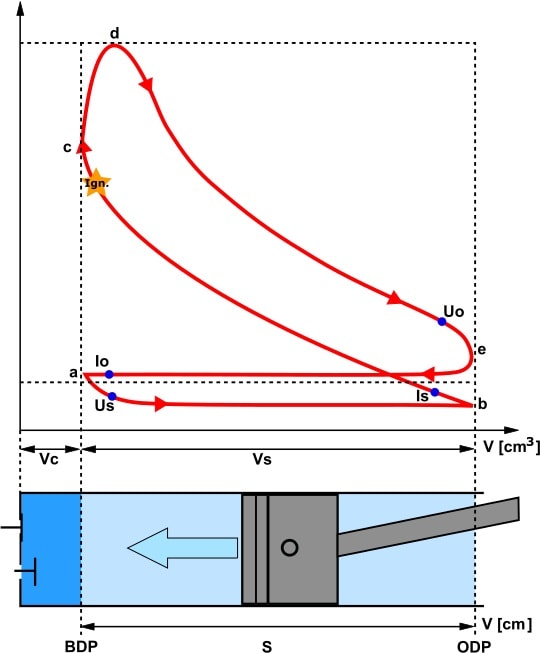
During the intake stroke, a vacuum is created in the cylinder. Drawing in air requires energy. This is also reflected in the indicator diagram. Between points a and b, the red line drops below p0 (atmospheric outside air pressure). Below this dotted line, a vacuum exists (area -W). We call this flow losses or scavenging losses.
Negative work (-W) costs energy and is therefore undesirable. Scavenging requires work. The exhaust pressure is higher than the intake pressure. The scavenging loop in naturally aspirated engines is counterclockwise.
Manufacturers use techniques to limit flow losses:
- variable valve timing;
- fast and large valve opening;
- optimal dimensioning of intake channels;
- smooth progression of channels in the intake tract (avoiding sharp transitions);
- pressure boost (via a turbo and/or supercharger).
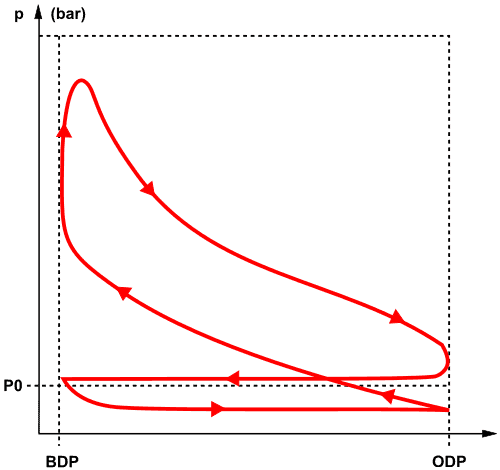
Engines equipped with pressure boost have less or no negative flow in the indicator diagram. The scavenging loop runs clockwise and now delivers work. The boost pressure helps press the piston downward during the intake stroke (from TDC to BDC).�a0The necessary compressor work is extracted from the exhaust gas since the turbo’s compressor wheel is driven by the turbine wheel. Thus, engines with pressure boost are significantly more efficient compared to naturally aspirated engines under the same conditions.
Effect of ignition timing on indicator diagram:
To achieve the lowest possible fuel consumption and high efficiency, it is essential to achieve the following:
- a short combustion time, hence a high combustion speed. This relates to the mixture composition;
- proper phasing of combustion relative to piston motion. This relates directly to ignition timing. The combustion midpoint should be about 5 to 10 crankshaft degrees after TDC. The midpoint is the heat release that occurs during combustion.
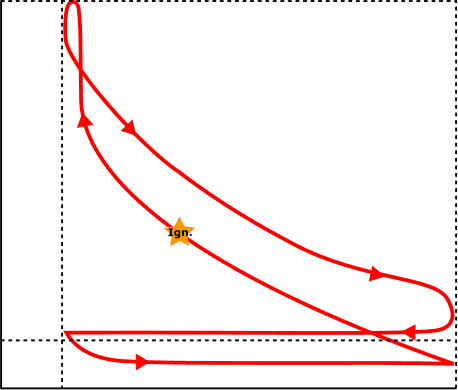
Both too early and too late ignition timing lead to increased heat release through the cylinder wall and thus a reduction in quality factor.�a0
- Too early ignition: pressure rises too early because the combustion begins early during the compression stroke. The piston is significantly slowed down before TDC due to combustion pressure. Too early ignition results in high peak pressures, reducing mechanical efficiency and posing a risk of engine defects.
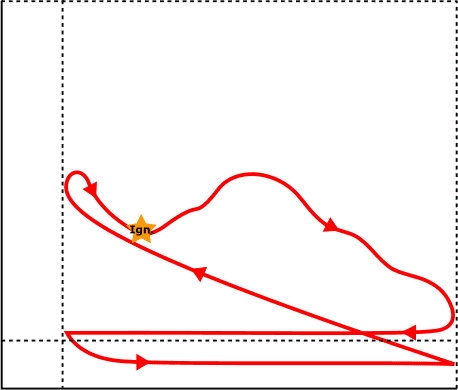
- Too late ignition: combustion is initiated too late. The piston is already moving towards BDC, causing insufficient pressure in the increasing volume. Additionally, burning gases flow past the exhaust valves. This results in excessively high temperatures. A lean mixture gives the same result: the gas burns too slowly. In a too lean mixture, gas still burns at the beginning of the intake stroke. In carburetor engines, this can cause kickback.
A modern engine management system determines the correct ignition timing from its maps: under all conditions, the ignition timing should be as close to the knock limit as possible.
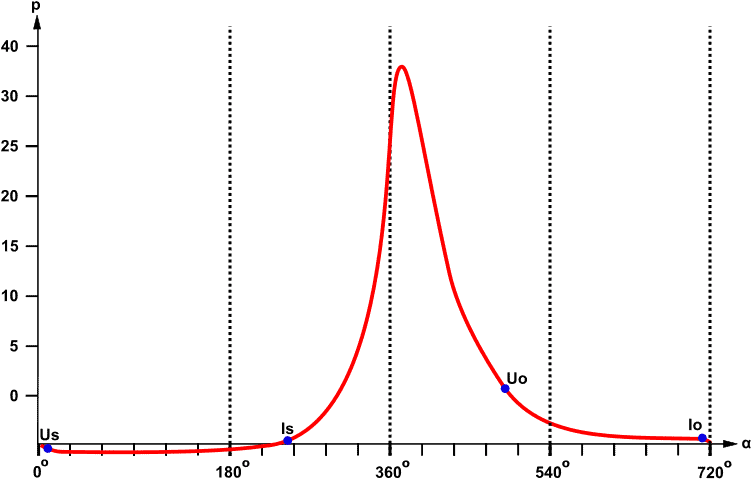
Pressure progression in the p-α diagram:
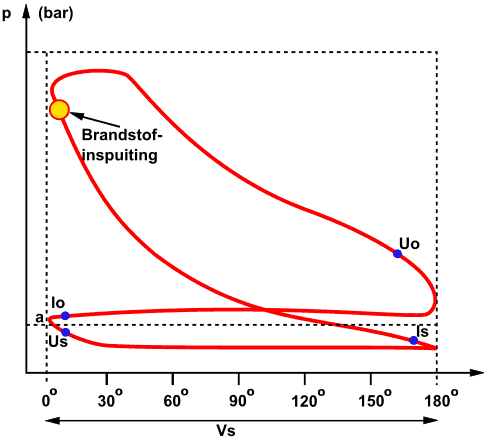
The indicator diagram can be converted into the tangential forces diagram. In this, the tangential force is depicted as a function of crank angle (alpha). We convert the indicator diagram into a diagram where the pressure (p) is shown as a function of the angle (α): the p-α diagram.
The following image shows the pressure progression in the cylinder during full load.
The blue points indicate, as in the “indicator diagram” paragraph, when the valves open and close:
- Intake valves open (Io) and close (Is)
- Exhaust valves open (Uo) and close (Us).
Additionally, we can see the current stroke of the engine based on crankshaft degrees:
- 0 degrees: TDC (end of exhaust stroke, beginning of intake stroke)
- 180 degrees: BDC (end of intake stroke, beginning of compression stroke)
- 360 degrees: TDC (end of compression stroke, beginning of power stroke)
- 540 degrees: BDC (end of power stroke, beginning of exhaust stroke)
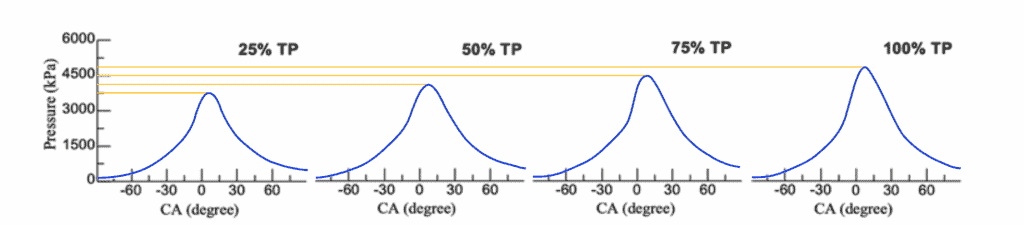
Peak gas pressure:
The peak gas pressure is highest during the power stroke. The pressure level depends on the engine load: when the engine delivers high power, the combustion pressure will be higher than during part load.
The following four images illustrate this: the Throttle Position (TP) indicates how much the engine is loaded concerning the Crank Angle (CA). In an average gasoline engine, there is a pressure of about 4000 kPa during part load combustion and around 5000 kPa during full load in this case. Engines with stratified injection, camshaft adjustment, and variable valve lift can see pressure rise above 6000 kPa.
Average gas pressure:
During the work process, the pressure in the cylinder varies greatly. During the intake stroke, a vacuum is present (if an exhaust gas turbocharger provides increased intake air pressure), and a pressure peak follows after the compression stroke. The higher the peak gas pressure, the more powerful the combustion.
To determine the average pressure of the combustion process, we can divide the indicator diagram into small rectangles of equal widths. The next image shows blue and green rectangles. By calculating the area of the blue rectangles, we can calculate positive pressure. We then subtract the area of the green triangles. This leaves us with the mean piston pressure.
With the mean piston pressure, we can determine the indicated and effective power of the engine, among other things. Visit the page: power, losses and efficiencies to read more about this.
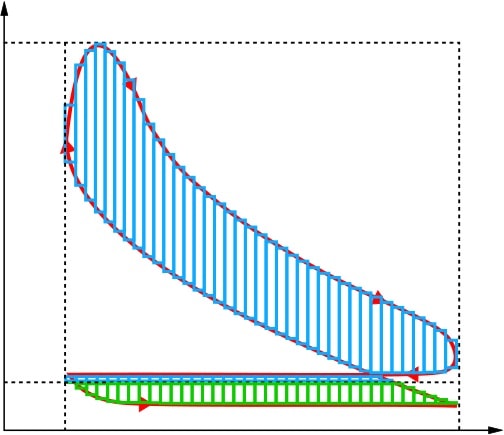
In the image, we see that the red line falls outside the blue rectangles: if we made the width of each rectangle smaller and thereby placed more rectangles side by side, we would get an increasingly smaller deviation. We can apply this infinitely. Of course, we will not do this in reality. Using mathematical functions, we can determine the area mathematically. We do this by integrating.