Topics:
- Introduction to Gear Ratios
- Force at the Wheels
- Determining the K-Factor Using the Geometric Series
- Determining the K-Factor Using the Corrected Geometric Series (the Jante Series)
- Determining Gear Ratios (Introduction)
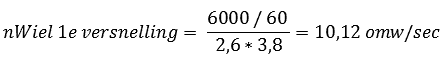
- Calculating the Reduction of the 1st Gear
- Calculating the Reduction of the 5th Gear (Using the Geometric Series)
- Calculating Other Reductions (Using the Geometric Series)
- Calculating Reductions Using the Corrected Geometric Series (Jante Series)
- Calculating Vehicle Speed Per Reduction (Geometric Series)
- Calculating Vehicle Speed Per Reduction (Corrected Geometric Series)
Introduction to Gear Ratios:
The gear ratio is determined by:
- The number of teeth on the gears (such as in the transmission)
- The diameter of the pulleys (such as those driven by the serpentine belt)
The image shows gear A having 20 teeth and gear B having 40 teeth. The ratio is 40/20 = 2:1.
This means gear A (driven) makes two revolutions for every one revolution of gear B. In practice, this is almost never the case. A ratio of exactly 2.00:1 is avoided because, in that scenario, the same teeth mesh with each rotation. If gear B had 39 teeth (1.95:1) or 41 teeth (2.05:1), the gears A and B would engage a tooth further with each rotation, reducing wear by 20 times compared to a 2:1 ratio.
A high gear ratio (where the driving gear is small and the driven gear is large) gives a high top speed, while a low gear ratio provides more pulling power. In a car’s transmission (in principle all motor vehicles), design considerations are made based on the purposes for which the vehicle will be used. A vehicle primarily designed to carry a heavy load will require more torque at lower gears than a sports car that needs to reach a high top speed. The gear ratio of the highest gear needs to be constructed in such a way that the maximum engine speed can be reached at maximum engine power. It would be a waste if the speed limiter kicks in while there is still plenty of power surplus for further acceleration. In addition to the highest gear, the lowest gear must also be carefully chosen; the vehicle should be able to easily pull away on a 40% incline in the harshest conditions. Furthermore, the ratios of the intermediate gears, i.e., 2, 3, and 4 (possibly also 5 if it’s a 6-speed transmission), need to be determined in between.
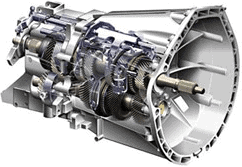
Force at the Wheels
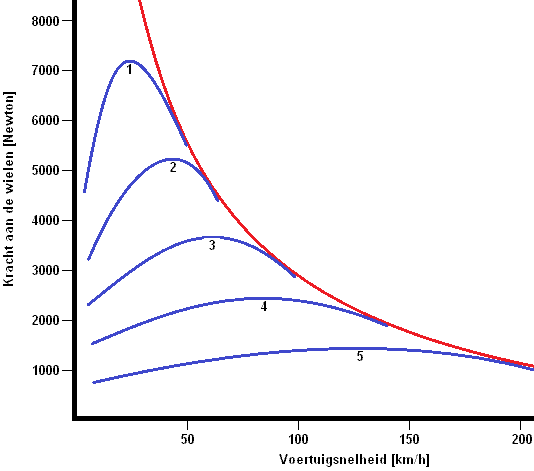
In the graph (in the image), the engine characteristics are shown with blue lines and the vehicle characteristics with the red line. Here it’s clearly seen that 1st gear delivers a high force at the wheels (approximately 7200N, or 7.2kN), while the highest gear (the 5th) delivers a maximum force of 1500N at the wheels.
As vehicle speed and gears increase, the force delivered at the wheels decreases. The slope of the blue lines results from the gear ratios, and the descending red line results from driving resistances (rolling and air resistance).
Determining the K-Factor Using the Geometric Series:
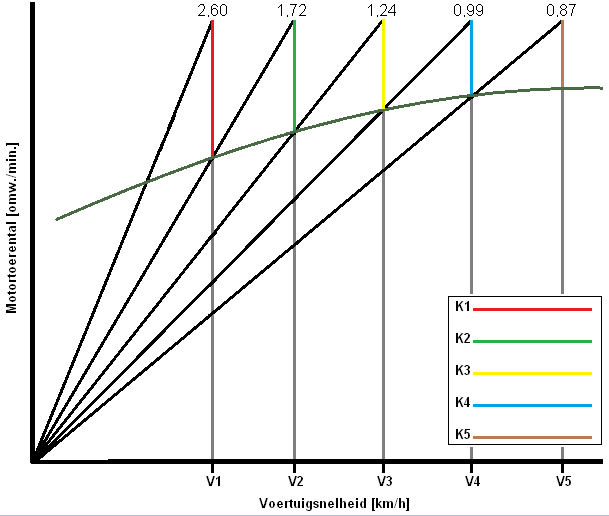
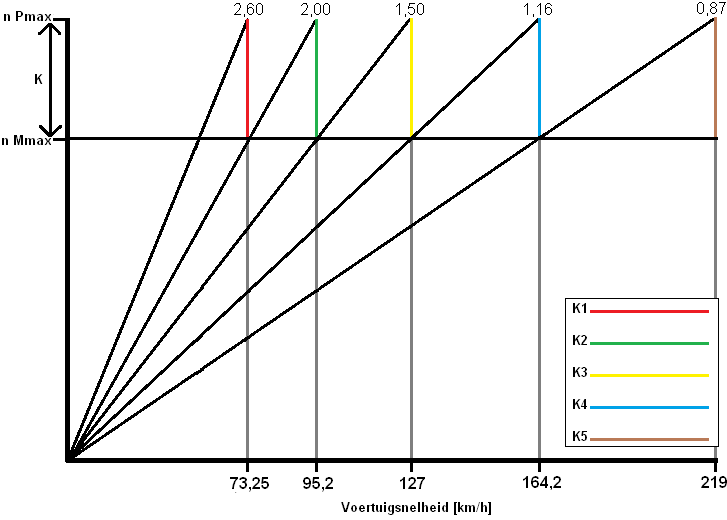
The following text pertains to the sawtooth diagram below.
If acceleration in 1st gear is done to the maximum engine speed, a shift to 2nd gear must occur.
After shifting and disengaging, the engine speed will have dropped but the vehicle speed will remain the same. When shifting from 1st to 2nd gear, the engine speed follows the red line in the graph below. The engine speed will fall from “n Pmax” to “n Mmax”.
The colored lines outline the K-factor. The size of the K-factor determines the length of the colored lines. If “n Mmax” and “n Pmax” are close to each other, the K-factor is small. There are thus smaller gaps between the gears.
With the other gears, it goes the same way. When accelerating to “n Pmax” in 2nd gear (up to V2), the green line is followed to “n Mmax” upon shifting.
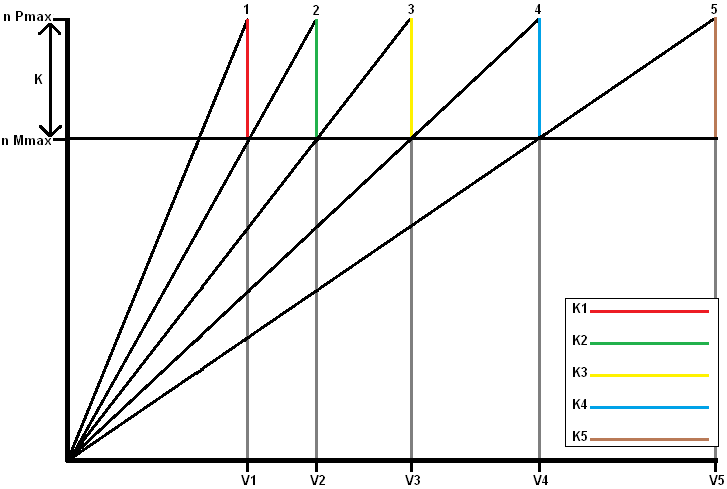
- n Pmax: The engine speed at which maximum power is achieved (e.g., 6000 rpm) with “n Pmax” as “engine speed at maximum power”
- n Mmax: The engine speed at which maximum torque is achieved (e.g., 4000 rpm) with “n Mmax” as “engine speed at maximum torque”
The ratios between the engine speeds and the gears remain the same. All colored lines (K1 through K5) also remain the same. The K-factor is determined by the engine characteristic. The K-factor lies between the engine speeds of the engine’s maximum torque and maximum power. This engine characteristic is used to calculate the transmission ratios of the gearbox. The K-factor for the geometric series can be determined as follows:
K = n Pmax / n Mmax
K = 6000 / 4000
K = 1.5
With a K-factor of 1.5, the reductions (gear ratios) of all gears are determined. These are all aligned accordingly. The geometric series is not applied to passenger cars due to the large gaps in the higher gears. Passenger car gearboxes are designed according to the corrected geometric series (the Jante series).
Determining the K-Factor Using the Corrected Geometric Series (the Jante Series):
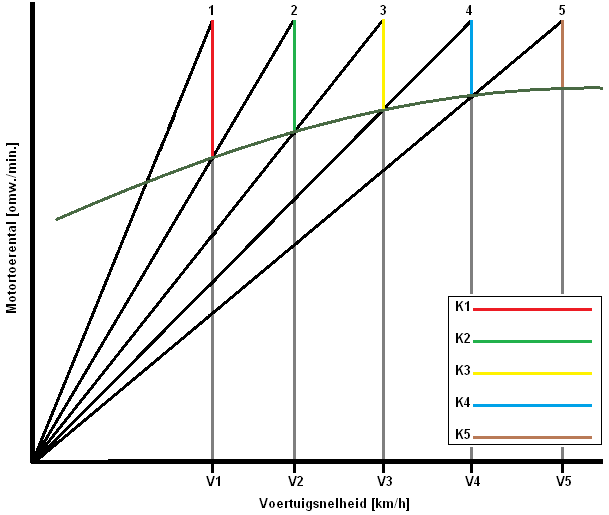
In passenger cars, the gaps between the lower gears are often large and become smaller at higher gears. Small gaps between higher gears result in minimal acceleration loss. Ratios in higher gears get smaller, allowing maximum use of engine power. You can notice this; between shifting from 1st to 2nd gear, the engine speed drops back further than between shifting from 3rd to 4th gear. This is visible in the sawtooth diagram below; the red line is larger than the yellow line:
The arithmetic series is also known as “the Jante series.” It is a corrected geometric series.
The K-factor differs between all gears. This offers significant advantages compared to the previously mentioned geometric series with a fixed K-value. As ratios in the higher gears get smaller, engine power is maximized. The force at the wheels is now greater than with the geometric series.
The K-factor is now different for each gear (all colored lines have different lengths), so each needs to be calculated. With the K-factor, the gear ratios of the transmission can be determined. Without knowing the K-factor, the reduction of the lowest or highest gear can still be determined, but the rest of the gears must then be calculated with the K-factor. Then the sawtooth diagram can be drawn.
Determining Gear Ratios (Introduction):
The gearbox designer must consider several factors. The transmission ratios need to be carefully configured. Factors such as the engine speeds where the engine has the most torque and power, the dynamic tire radius, differential reduction, and the overall efficiency of the drivetrain are important. This is summarized below:
Engine speeds where the engine has the most torque and power:
These are the engine speeds “n Pmax” and “n Mmax” shown in the diagram of the geometric series above.
Dynamic tire radius:
This is the distance between the hub center and the road surface. The smaller the wheel, the higher the wheel rotation speed at the same vehicle speed. The dynamic tire radius can be calculated as follows (if it is already known):
The tire size must be known to calculate this. As an example, let’s take the tire size 205/55R16. This means the tire is (205 x 0.55) = 112.75mm = 11.28cm high. Since it is 16 inches, it needs to be converted to centimeters: 16 x 2.54(inch) = 40.64cm.
It involves the distance from the road surface to the hub, so the total height of 40.64cm must be divided by 2: 40.64 / 2 = 20.32 cm.
The dynamic tire radius (Rdyn) is now: 11.28 + 20.32 = 31.60cm.
Differential reduction:
The differential always has a fixed gear ratio. The gearbox must be tuned to it. Commercial vehicles can have up to 5 differentials in the drivetrain.
The efficiency of the total drivetrain:
Due to e.g., friction losses, a certain percentage of loss always occurs. This also depends on the oil thickness (and the temperature). Efficiency usually ranges around 85 to 90%.
Now we will determine the gear ratios (reductions) for a hypothetical engine and transmission.
The following specifications are known:
- Vehicle mass: 1500kg
- Gravitational acceleration (G): 9.81m/s2
- Type of transmission: 5-speed manual transmission with reverse
- Dynamic tire radius: 0.32m (= 31.60cm from the previous calculation)
- Differential reduction: 3.8:1
- Drivetrain efficiency: 90%
- Maximum vehicle speed: 220km/h (220 / 3.6 = 61.1m/s)
- Maximum incline: 20%
- Rolling resistance coefficient (bc): 0.020
- n Pmax: 100kW at 6500 rpm
- n Mmax: 180Nm at 4500 rpm
First, the torque the wheels can transfer to the road surface must be determined. This depends on the situation the vehicle is in, such as whether it is driving on an asphalt road with a low rolling resistance coefficient. This can be calculated along with the rolling resistance and the dynamic tire radius. The formula for rolling resistance is as follows:
Frol = bc x m x g x cos 3b1 (for explanation, see the page driving resistances)
Frol = 0.020 x 1500 x 9.81 x cos 18 = 279.9 N
Since there is an incline, Fhill must also be calculated:
Fhill = m x g x sin 3b1
Fhill = 1500 x 9.81 x sin 18 = 4547.2 N
Air resistance can be neglected, so the total driving resistance is as follows:
Frij = Frol + Fhill
Frij = 279.9 + 4547.2 = 4827.1N
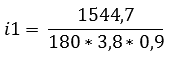
To calculate the maximum torque the wheels can transfer to the road surface, Frij must be multiplied by the dynamic tire radius
Twheel = Frij x Rdyn
Twheel = 4827.1 x 0.32
Twheel = 1544.7Nm
K-factor:
Now we will calculate the K-factor:
K = n Pmax / n Mmax
K = 6000 / 4500
K = 1.33
Calculating the Reduction of the 1st Gear:
The formula for calculating the first gear is as follows:
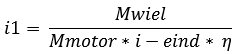
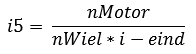
Calculating the Reduction of the 5th Gear (Using the Geometric Series):
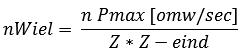
The reduction of the 5th gear can also be determined in a similar manner. The 5th gear must be determined based on the maximum engine speed, as it would be unfortunate if the engine still has enough power to accelerate further while the maximum engine speed (and thus the car’s top speed) has been reached. Likewise, the wheel speed (nWheel) at maximum vehicle speed is important. It must be calculated first:
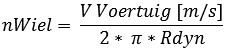
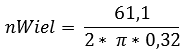
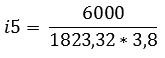
Now that the wheel speed is known at the maximum vehicle speed of 220km/h (61.1 meters per second), the reduction of the 5th gear can be calculated.
Calculating Other Reductions (Using the Geometric Series):
According to the calculations, the reduction of the 5th gear is 0.87, and the K-factor is 1.33.
With this information, the reductions of the 2nd, 3rd, and 4th gears can be calculated (using the geometric series).
i5 = (previously calculated)
i4 = K x i5
i3 = K x i4
i2 = K x i3
i1 = K x i2
The reduction i1 is known here, so if the rest is correctly calculated, the same number (2.51) should be obtained. A slight deviation is normal due to many intermediate roundings. Now the series of all reductions can be filled in. Calculations must be done from top to bottom. The answer for i5 is used in i4, and from i4 in i3, etc.
i5 = 0.87
i4 = 1.33 x 0.87 = 1.16
i3 = 1.33 x 1.16 = 1.50
i2 = 1.33 x 1.50 = 2.00
i1 = 1.33 x 2.00 = 2.60
The table for the geometric series can now be completed.

Calculating Reductions Using the Corrected Geometric Series (Jante Series):
Earlier on the page, the difference between the geometric series and the “corrected” geometric series was explained. The corrected geometric series, also known as the “Jante series,” has the advantage that the K-factor at higher reductions is closer together. The K-factor in the geometric series was constant (this was n P max divided by n M max, and amounted to 1.33). This also gave a constant value in the graph.
In the corrected geometric series, there is a line in the graph indicating that the K-value is not constant. With each gear, the K-factor becomes smaller.
The corrected geometric series does have a constant value. We denote this with an m. The value of m = 1.1.
The general formula for the K-value of the corrected geometric series is as follows:
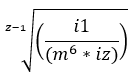
Explanation of the formula:
z-1 = the number of gears minus one
i1 = reduction of first gear
m to the sixth power = constant to the power of 6
iz = the total number of gears
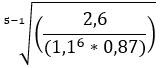
Tip: enter the fourth root in the calculator as follows: first press 4, then SHIFT followed by the root symbol with an x above it (x 4e a). Then pay attention to the use of parentheses for the correct order of operations (mvdwao).
The answer to the above calculation is: 1.14
The K-value of the corrected geometric series is thus 1.14. We will continue with this:
i5 = (previously calculated)
i4 = K x i5
i3 = K2 x m x i5
i2 = K3 x m3 x i5
i1 = K4 x m6 x i5
i5 is known; it is 0.87. The K-value is 1.14, and m is 1.1. With this information, we can complete the table:
i5 = 0.87
i4 = 1.14 x 0.87
i3 = 1.142 x 1.1 x i5
i2 = 1.143 x 1.13 x i5
i1 = 1.144 x 1.16 x i5
i5 = 0.87
i4 = 0.99
i3 = 1.24
i2 = 1.72
i1 = 2.60
The table for the corrected geometric series can now be completed:
Calculating Vehicle Speed Per Reduction (Geometric Series):
Per reduction, the vehicle speed can be determined. This is the speed the vehicle can achieve in this gear at the maximum engine speed of 6000 revolutions per minute. The calculation is as follows:
Vvehicle 1st reduction = 2 x π x nWheel x Rdyn
(nWheel has just been calculated for the first gear, and Rdyn was already known; this equals 0.32m. The formula can then be filled in:
Vvehicle 1st reduction = 2 x π x 10.12 x 0.32
Vvehicle 1st reduction = 20.35 m/s x 3.6 = 73.25 km/h
The other gears can be easily calculated by changing Z = 2.60 in the first formula to the reduction of the desired gear and then filling it in as nWheel in the second formula.
The other gears have the following results:
2nd gear: 95.2 km/h
3rd gear: 127 km/h
4th gear: 164.2 km/h
5th gear: 219 km/h (this is the car’s top speed)
These speeds can be filled into the table of the geometric series.
Calculating Vehicle Speed Per Reduction (Corrected Geometric Series):
The calculation is exactly the same and is therefore not repeated.
1st gear: 73.2 km/h
2nd gear: 110.75 km/h
3rd gear: 153.61 km/h
4th gear: 192.40 km/h
5th gear: 219 km/h
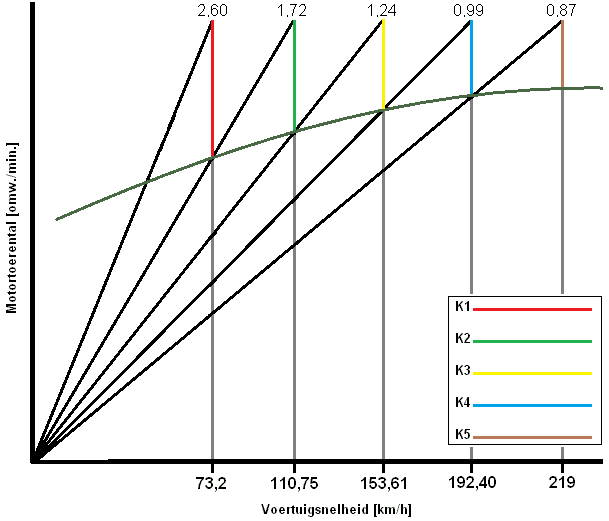
As is now clearly visible, the car’s top speeds are the same in both the geometric and the corrected geometric series. In the geometric series (the first one), the gaps between the higher gears are very large, and in the corrected geometric series, the gaps between all gears are almost equal. The latter is applied in modern vehicles.