Update: Due to issues following changes within Google Analytics (UA to GA4) and a possible future ban (source: Tweakers), I deactivated Google Analytics on July 1, 2023. Statistics are now exclusively tracked by the server software (AWstats). I will share more about this later.
With the help of Google Analytics, I collected website statistics until July 1, 2023. The data is anonymized, so IP addresses, personal data, or websites in your browser history are not recorded. Page views are counted, which gives me insight into the number of visits and popular pages. I can also see whether you visit the site with a desktop/laptop or mobile/tablet. Below is an image of the statistics measured over one year.
- the peaks are the weekdays from Monday to Friday. Generally, the site is busiest on Monday and Tuesday;
- the lows are on weekends, where the number of visitors often halves compared to the workweek;
- During school holidays, the number of visitors drops significantly. We can clearly see this in the table during the Christmas and summer holidays.
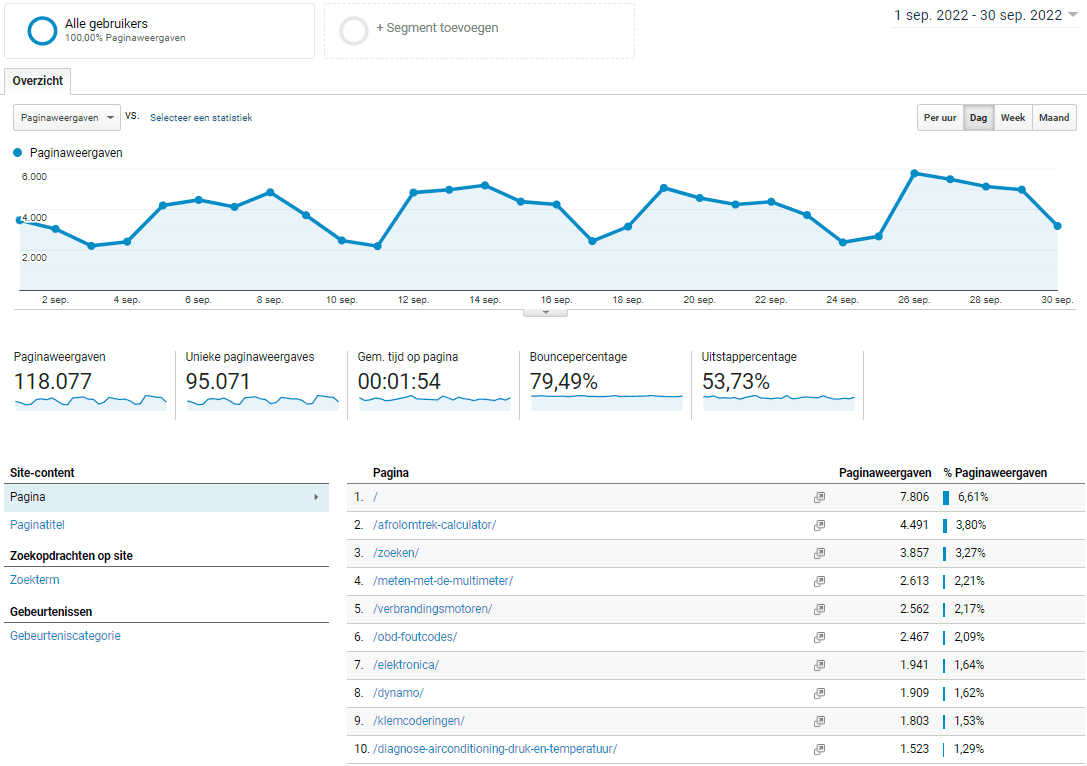
The unique page views are the visitors who open the website for the first time. This could be: after clearing cookies, or from the same visitor on another day, so that this visitor is seen as unique. The number of page views always exceeds the unique page views: if a visitor clicks on two pages, this is seen as one unique visitor with two page views.
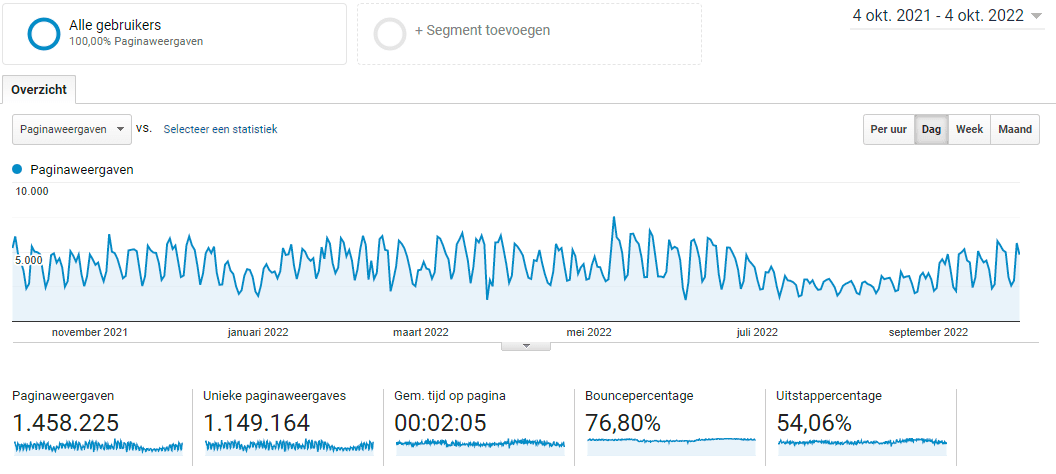
The average time on the page is approximately 2 minutes. This is due to:
- visitors who read a page attentively can spend more than 10 minutes on a page before clicking away;
- if a page remains open for longer than 5 minutes, Google Analytics stops counting;
- visitors searching and navigating through the menus between several tiles or typing a keyword on the search page have also clicked multiple times. Each “click” through the menu, or from one page to another, is tracked. Thus, the time between clicking on the tiles can be less than 10 seconds.
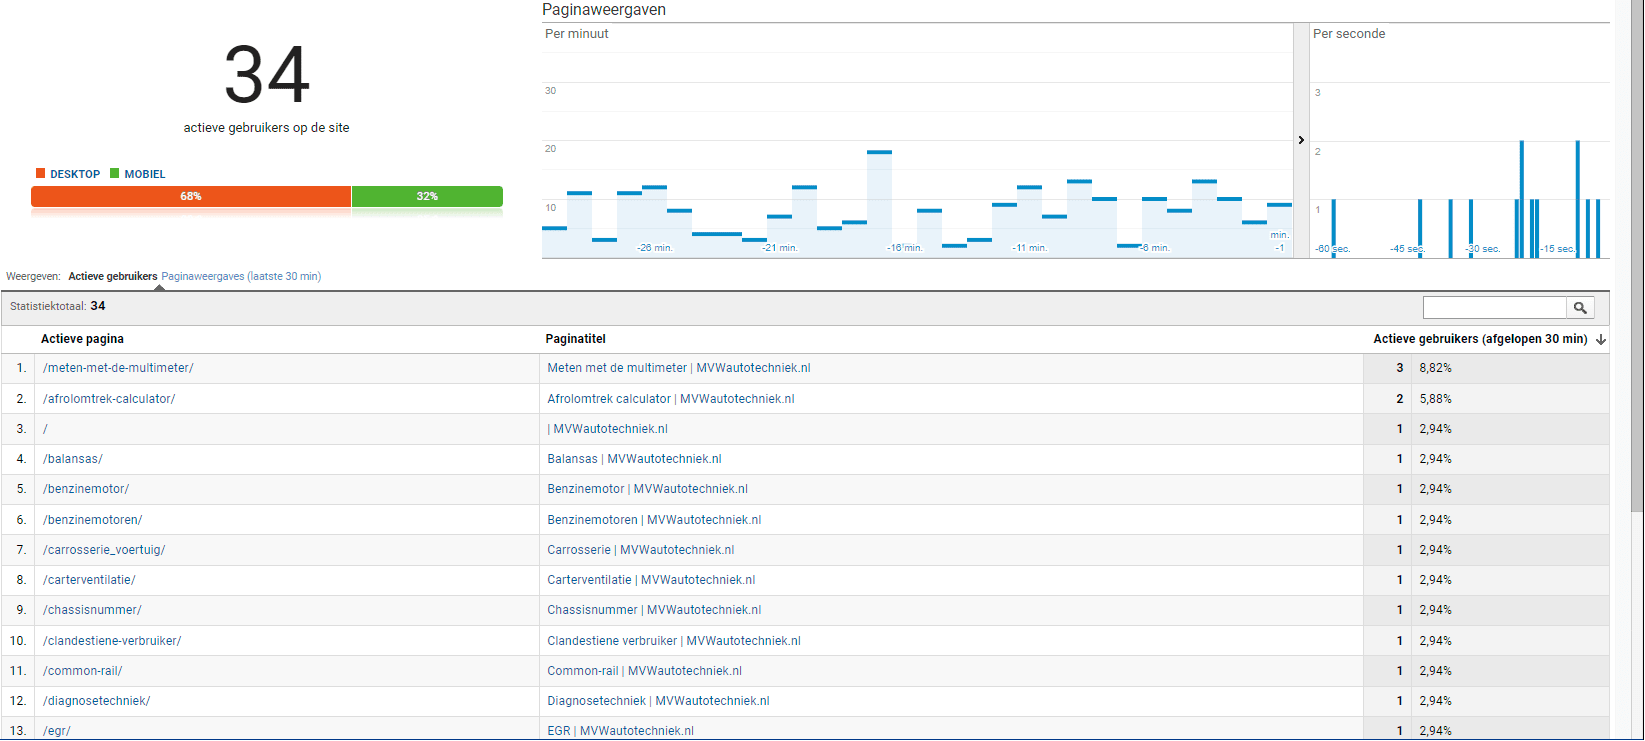
On weekdays, there are often between 20 and 40 active users on the website at any given time. With the aid of “real-time” statistics in Google Analytics, I can see which pages are open in browsers at that moment. The image below shows the number of active users on Tuesday morning, October 5, at 10:30 AM.