Seiliger Process:
The Seiliger process is a cycle process for engine combustion. Both the diesel and the gasoline engine are based on this, but the final pressure course differs; the diesel engine is a constant volume process and the gasoline engine a constant pressure process.
The Seiliger process is straight from thermodynamics. During the compression of air, pressure increases and volume decreases (the compression stroke). During the power stroke, the volume increases. The volume decreases during the exhaust stroke. The Sankey diagram is determined using the Seiliger process.
Seiliger Process:
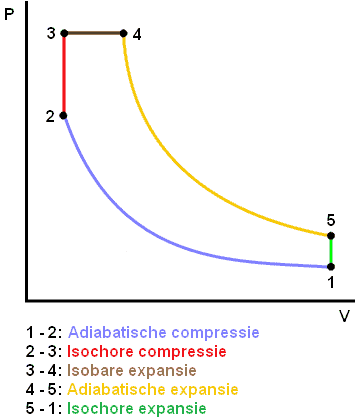
1 – 2: Adiabatic Compression: There is no heat exchange with the surroundings. The piston compresses the mixture without the material heating up. All heat remains in the mixture. (Compression Stroke)
2 – 3: Isochoric Compression: The volume remains constant and the pressure increases. This is still the compression stroke.
3 – 4: Isobaric Expansion: The pressure remains constant and the volume increases (Power Stroke).
4 – 5: Adiabatic Expansion: Again, there is no heat exchange with the surroundings. The piston moves downward again (Power Stroke).
5 – 1: Isochoric Expansion: The pressure decreases at a constant volume (Exhaust and Intake Stroke).
- Adiabatic: No temperature exchange with the surroundings, the process is reversible.
- Isochoric: Volume remains constant.
- Isothermal: Temperature remains constant.
- Isobaric: Pressure remains constant.
- Isentropic: Reversible process.
The adiabatic compression is often described in books and on websites as isentropic compression. Because the gas cycle in the internal combustion engine occurs so quickly (through intake, compression, power, and exhaust strokes), there is almost no time during the compression and power strokes for temperature exchange with the engine materials. Therefore, it can be better described as adiabatic compression and expansion. Hence, this page refers to adiabats, not isentropes.
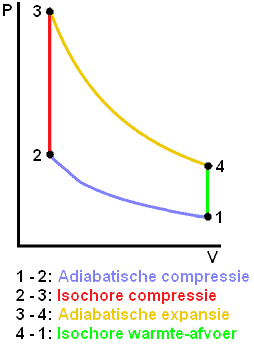
PV Diagram of a Gasoline Engine (Otto Engine):
The PV diagram of a gasoline engine can be described as a constant volume process. During adiabatic compression (from 1 to 2), there is no heat exchange with the surroundings. This is the case with isochoric compression (2 to 3), where the engine material warms up. This does not occur in a diesel engine. This is also why the gasoline engine reaches operating temperature faster than a diesel engine. The efficiency of a gasoline engine decreases due to isochoric compression. The adiabatic expansion and the isochoric heat discharge are almost the same for both gasoline and diesel engines.
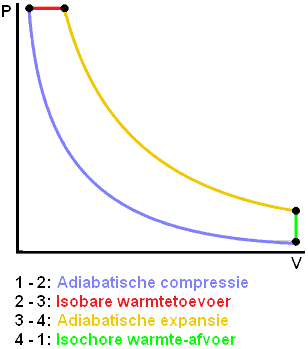
PV Diagram of a Diesel Engine:
Since combustion in a diesel engine occurs gradually (by injecting multiple times), the pressure does not change with increasing volume.
The isobaric heat supply (2 to 3) is the combustion of the fuel. The area of the diagram (the area between the lines) of a diesel engine is larger than that of a gasoline engine. Therefore, the efficiency of a diesel engine is higher.
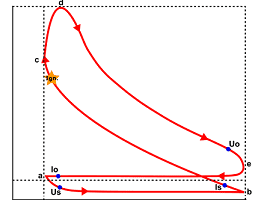
Theoretical vs. Actual Cycle:
The Seiliger / PV diagram are for ideal gasoline and diesel engines. In reality, pressures and volumes behave differently because there are always non-ideal gases and losses. The actual cycle process is represented in the indicator diagram.
Related Pages: