Introduction:
An in-cylinder pressure test is a measurement method that visualizes pressure changes in a cylinder of an internal combustion engine throughout the entire engine cycle. This measurement can conduct a compression test where, like a classic compression test, the pressure at the end of the compression stroke is determined. Furthermore, an in-cylinder pressure test allows for the analysis of the complete pressure course during the intake stroke, compression stroke, power stroke, and exhaust stroke.
A commonly used tool today to measure cylinder pressure is the WPS500x pressure transducer by PicoScope. Besides this brand, similar pressure sensors are available from Fluke and a few less common brands. Since the WPS500x is very popular in automotive workshops in 2026 and is also used in national practical exams, we focus specifically on the scope images recorded with this measurement system on this page.
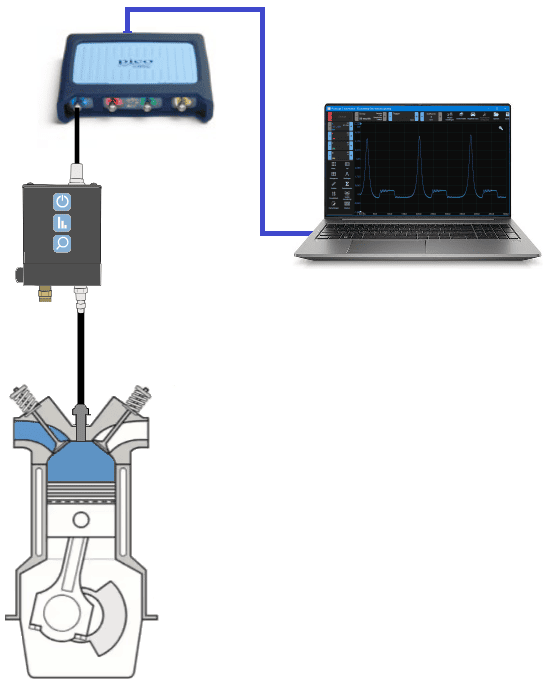
The WPS500x is a high-resolution pressure sensor that is directly mounted in the combustion chamber using a spark plug adapter (gasoline engine), glow plug adapter, or injector adapter (diesel engine). The sensor converts the existing cylinder pressure into an electrical signal. This signal is displayed by the PicoScope as a pressure graph, plotted against time or crankshaft position. The software allows the WPS500x to be selected, changing the Y-axis from volts to bar.
The image next to it shows the setup of the WPS500x on an automotive scope connected via a USB cable to a laptop.
The laptop shows a measurement of the pressure course during a turning engine. Both the fuel injection and ignition of the cylinder are disabled, so the piston causes air displacement without combustion. For the mechanic or technical specialist, it’s interesting to see how much vacuum exists during the intake stroke and how much overpressure exists during the compression, power, and exhaust stroke.
The following paragraphs explain how to read the pressure course during starting and running of the engine, what the different sections show, how possible malfunctions in the four-stroke process can be recognized and what steps can be taken to find the cause.
Pressure Course with Idling Engine:
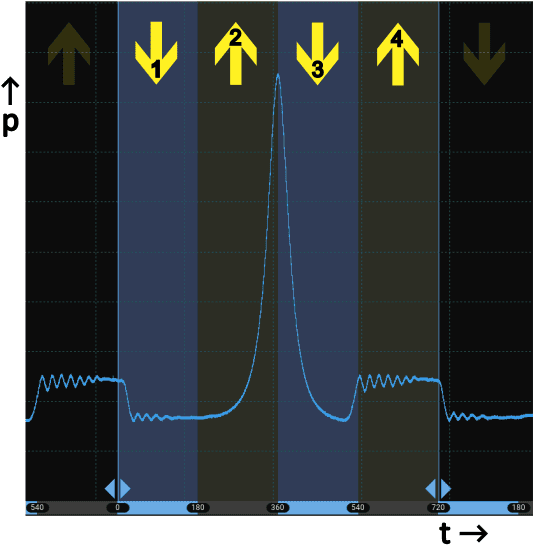
Once the measuring equipment is installed, and the injection and ignition of the cylinder to be measured are disabled, and the engine is idling, the pressure course (p) relative to time (t) is created, as shown in the image on the right.
The blue-gray colored boxes are placed with a PicoScope setting by selecting “Phase Rulers” at “Rulers” and for 720 degrees. The rulers are aligned on the pressure peaks of the compression strokes, which remain visible in a running engine without combustion. Below, the pressure course in the different phase rulers with the yellow arrows and numbers are explained.
- Intake stroke: between 0 and 180 crankshaft degrees. In this area, there is a vacuum in the cylinder to suck in the intake air;
- Compression stroke: at t = 180 degrees, the pressure build-up of the compression stroke begins up to the top of the pressure peak. At 360 degrees, the end of the compression stroke is reached;
- Power stroke: the piston moves from TDC to BDC. Note: this is not literally a power stroke but the expansion of the air volume, as there is no combustion;
- Exhaust stroke: at t = 540 crankshaft degrees, the piston moves to BDC, creating a slight overpressure: here, the exhaust valve opens, and the gases are expelled. At t = 720 degrees, the intake stroke of the next cycle begins again.
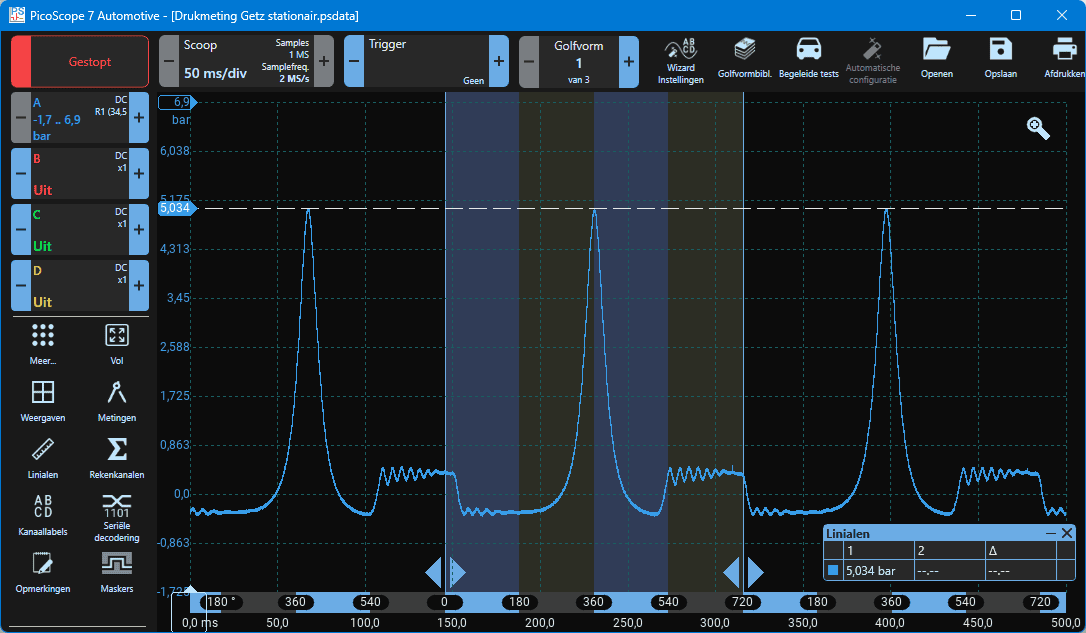
The complete scope image with the corresponding settings is shown below. The compression end pressure is approximately 5 bar and is indicated with the ruler. Because the engine is idling, the throttle valve is almost closed due to the active idle control. This results in less air being sucked into the cylinder, the manifold pressure is about 30 to 40 kPa, and the cylinder’s filling ratio is low, resulting in lower compression pressure.
Pressure Course During Engine Start:
As with an idling engine, during starting, the injection and ignition of the respective cylinder must be switched off. To allow as much air as possible into the cylinder, the throttle valve must be fully open during starting:
- Engines with an electronically controlled throttle pedal combined with direct injection and valve lift control: the throttle may already be automatically fully opened during starting;
- Engines with a throttle cable (bowden cable): in this case, the accelerator pedal must be fully depressed or the throttle manually opened under the hood.
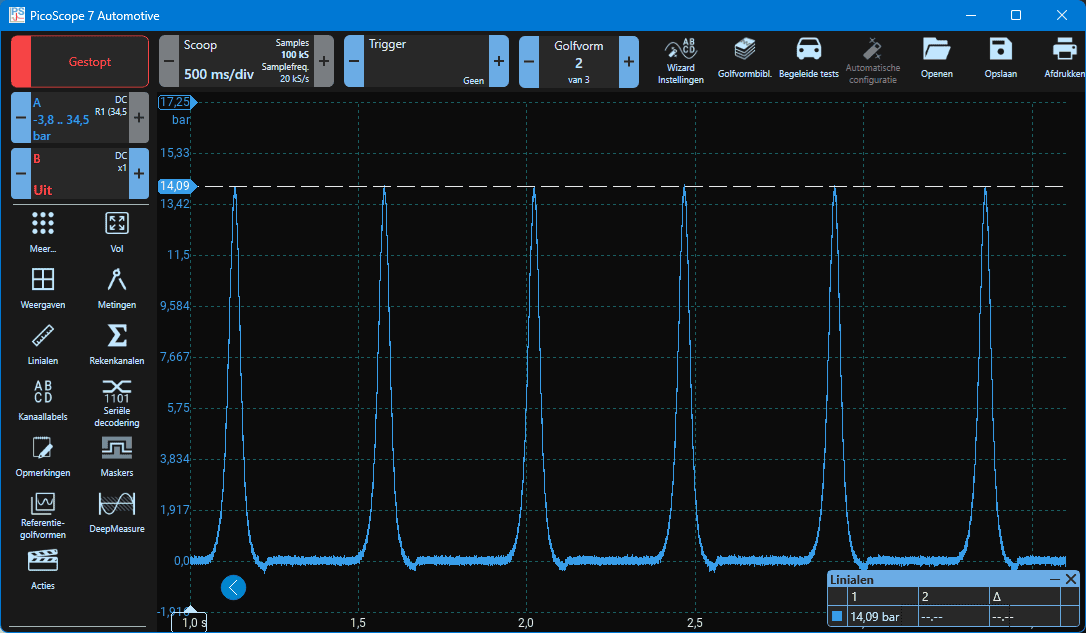
During starting, the compression end pressure will appear on the scope. This compression measurement is comparable to the classic method with a compression card: the same end pressure will be displayed. The compression end pressure is visible in the course in the image below. For the same engine, where the compression pressure during idling (was) only 5 bar, the pressure during starting is about 14 bar, which is a decent value for this engine. This measurement can be repeated for each cylinder to see the mutual differences.
Pressure Course During Start with Compression Loss:
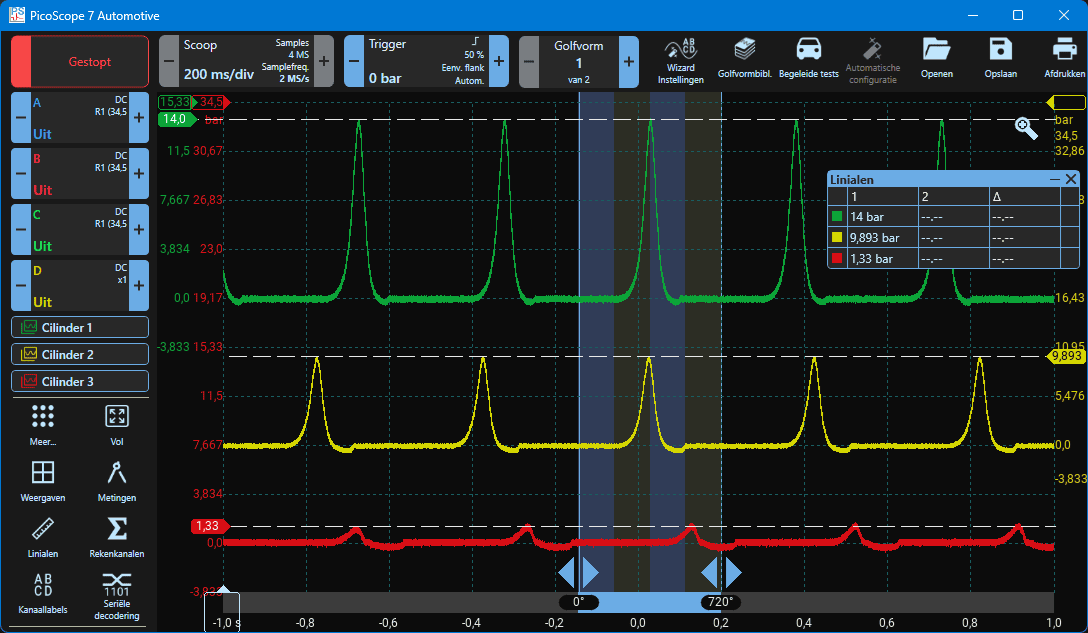
During starting with an open throttle, we see the compression end pressure on the scope image at each compression stroke. When compression loss is suspected, we connect the pressure gauge to a different cylinder after each measurement. In this experiment, a motor was measured with engine damage inflicted to facilitate such measurements.
- Cylinder 1: a compression end pressure of 14 bar. This is okay and is also the reference for the other cylinders to be measured;
- Cylinder 2: the compression end pressure is less than 10 bar. Here there is compression loss;
- Cylinder 3: in this image, only a minimal pressure increase of 1.33 bar is visible. This means that hardly any air pressure is building up, and there is a high chance of significant damage here.
Below the scope image, we further zoom in on the pressure course of the green and yellow curves (cylinder 1 and 2), focusing on the rise-rate and fall-rate times.
With the rulers, the difference in the rise-rate and fall-rate time can be made clear.
- Vertical ruler 1: in the width of the top peak pressure (t = 729.3 ms)
- Horizontal ruler 1: at the height of the top peak pressure (p = 13.83 bar)
- Horizontal ruler 2: halfway up the rising pressure (p = 6.89 bar)
- Vertical ruler 2: on the tangent between the graph and horizontal ruler 2.
In the scope images below, the red points indicate the tangents of the rulers. This allows the determination of the rise-rate time (t1) and the fall-rate time (t2). The explanation of the scope image with the green curve (cylinder 1) continues below the image.
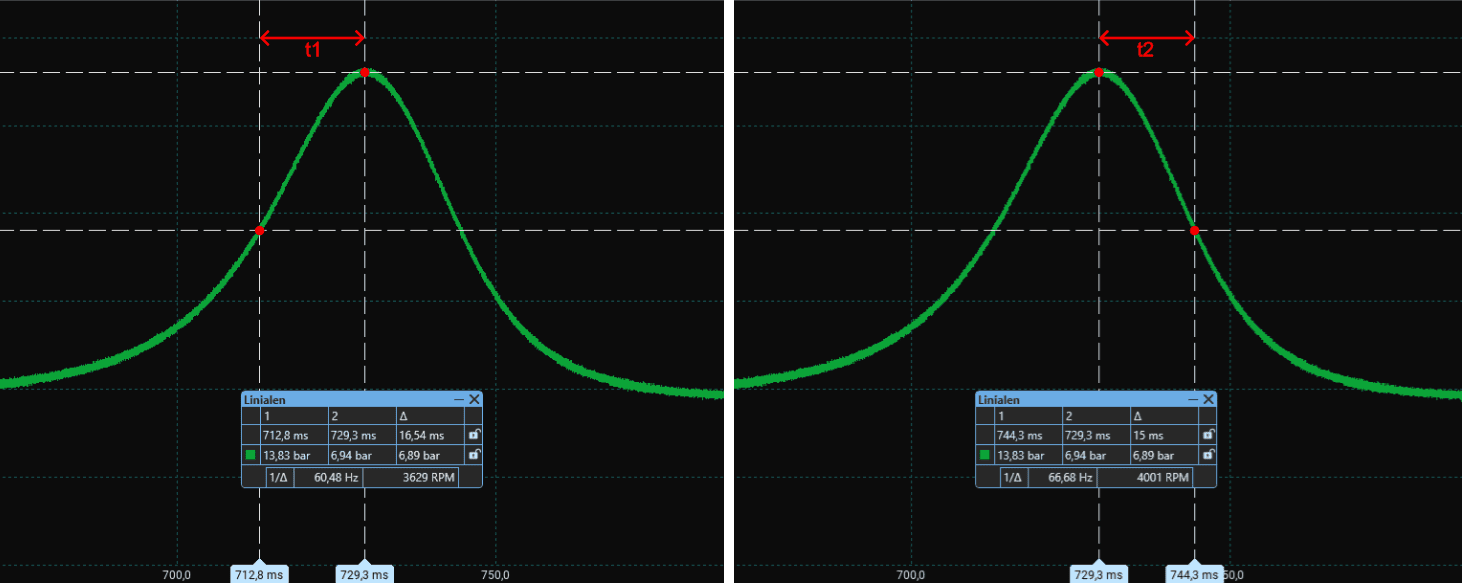
Using the horizontal and vertical rulers, the time differences can be precisely determined. In the above scope image (of cylinder 1), we read the following times from the rulers:
- t1: 16.54 ms
- t2: 15 ms
The time difference between t2 and t1 is: (16.54 – 15) 1.54 ms. This is characteristic of a well-functioning engine: the rise and fall-rate times are almost equal. The expansion (TDC -> BDC) is slightly faster than the compression (BDC -> TDC): it takes more effort (and thus time) to compress the air than to let the air pressure help push the piston back to the BDC.
The explanation of the yellow curve (cylinder 2) continues below the image.
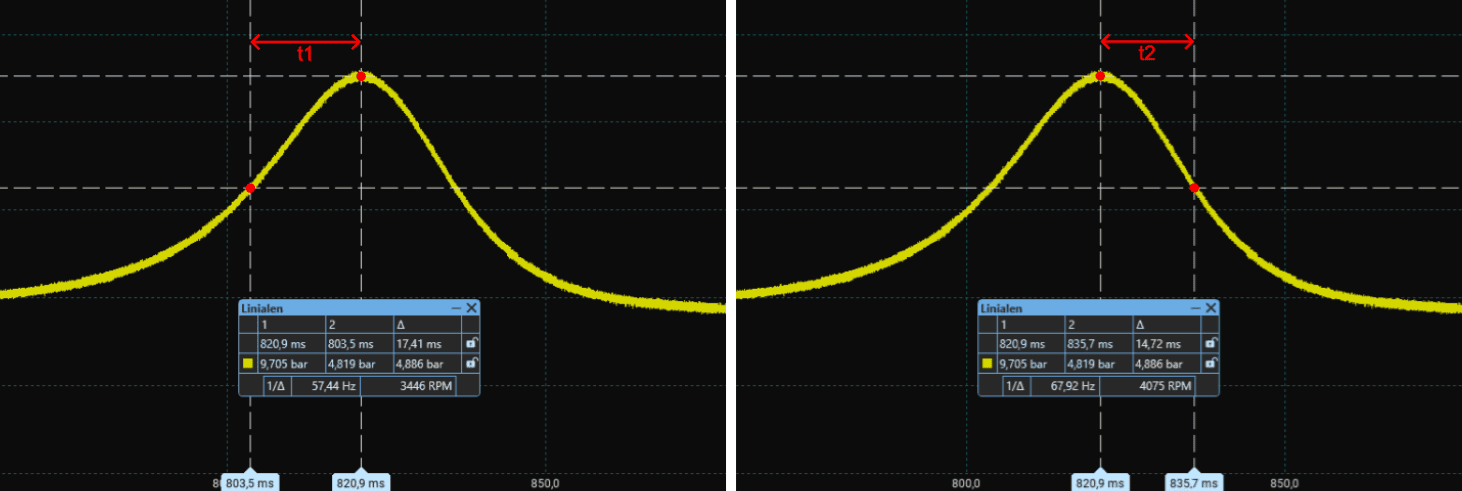
In the above scope image of cylinder 2, the time difference between t2 and t1 is: 2.69 ms. This time difference is larger than in the cylinder where there is no compression loss, meaning the pressure build-up and decrease do not proceed at the same speed. One of the sides is steeper or flatter than the other. This indicates compression loss in the cylinder.
The causes of compression loss are diverse. There are many possibilities of air leakage in the combustion chamber, of which these are the most common practical examples:
- burnt intake or exhaust valve;
- worn compression rings;
- scratches in the cylinder wall, preventing proper sealing between piston and cylinder;
- faulty head gasket;
- piston fracture;
- crack in the cylinder head;
- leakage along injector or nozzle.
When there is compression loss, additional measurements can be made to determine where the air leakage occurs. With burnt valves, an air pulse can be measured in the intake manifold or exhaust system. This can be done with both the WPS500x and the so-called First look sensor from PicoScope.
Even with less extensive measuring equipment, the diagnosis can be deepened. With a classic cylinder leak tester, compressed air is applied to the cylinder. Depending on the location of the leak, a hissing or whistling sound can then be heard in the intake channel, exhaust channel, or crankcase ventilation. In the case of a leak towards the cooling system, air bubbles may also be visible in the coolant reservoir. The escaping air from the cylinder will always manifest itself in one of these places.
When potential engine damage is suspected, an endoscope can be used to look inside the cylinder. This allows visible abnormalities to be identified on the valves, piston, or cylinder wall.
Pressure Course During Start with Choked Intake:
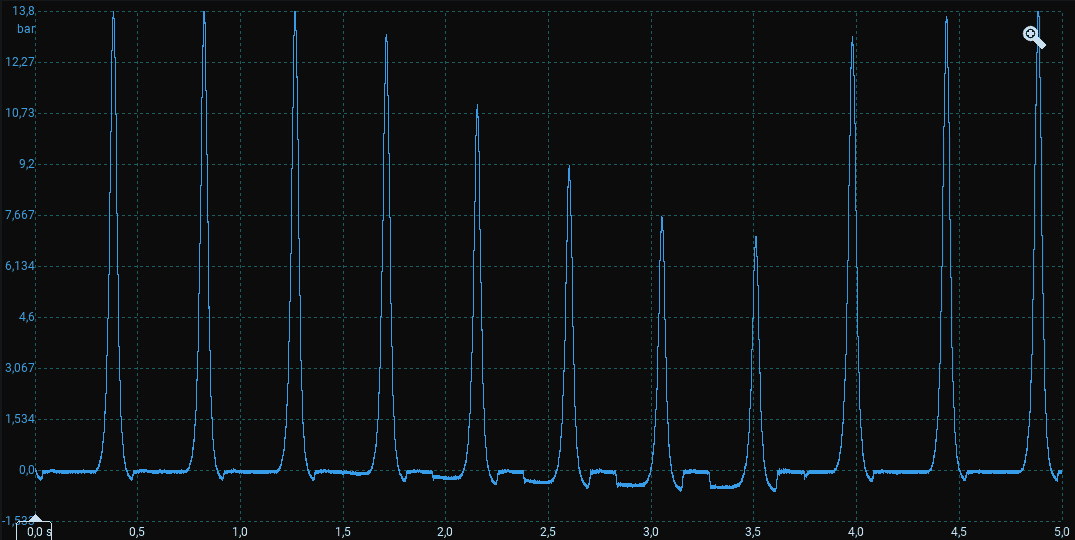
When there is a restriction in the intake channel, more vacuum is created during the start of the engine as the piston draws in the air. As a result of the higher vacuum, the filling ratio is lower. To understand what happens with the air pressures, in this experiment, the intake channel is choked by keeping it closed. These effects are shown in the scope image below.
- Between t = 0 and 1.5 seconds, we see a normal pressure course;
- After the compression stroke (after t = 1.5 s.), the air pressure starts to drop during the intake stroke. This drop continues every intake stroke until t = 3.5 s.
- From t = 1.5 s. the compression end pressure also begins to decrease to about 7 bar at the lowest compression peak;
- After t = 3.5 s. the air supply is reopened and we see the vacuum during the intake stroke become less high and the compression end pressure rise.
The same scope image is shown below, but now with rulers to accurately see the pressure difference in the intake. The difference between the “normal” and abnormal intake stroke is almost 470 mbar due to the intake restriction.
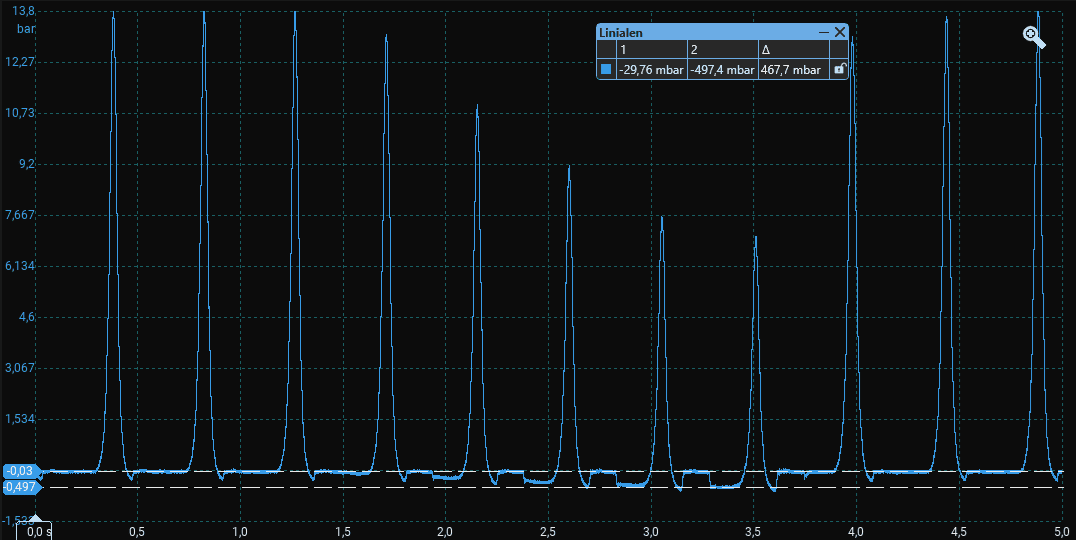
In this experiment, the restriction was applied and removed to visualize the deviations in the signal in between. When a pressure measurement is performed with an existing problem, the ‘higher vacuum’ and ‘lower compression end pressure’ will be present throughout the measurement.
Practical examples of a choked intake may result from:
- Worn intake cams, resulting in minimal valve lift;
- Loosely adjusted valve clearance causing the intake valve to open too briefly;
- Incorrect valve timing, possibly due to incorrect camshaft (VVT) adjustment;
- Object in the intake blocking air flow, such as a swirl flap (butterfly valve) that has broken off from the variable intake manifold;
- Intake path clogged with carbon due to extreme engine pollution;
- Worn (and thus flexible) intake hose being sucked closed by vacuum;
- Throttle does not fully open due to a faulty actuator or mechanical restriction;
- Severely contaminated or incorrectly mounted air filter.

The above practical examples may apply to only one cylinder or all cylinders. If the problem is not present in other cylinders, causes like a contaminated air filter can already be ruled out.
Pressure Course During Start with Exhaust Restriction:
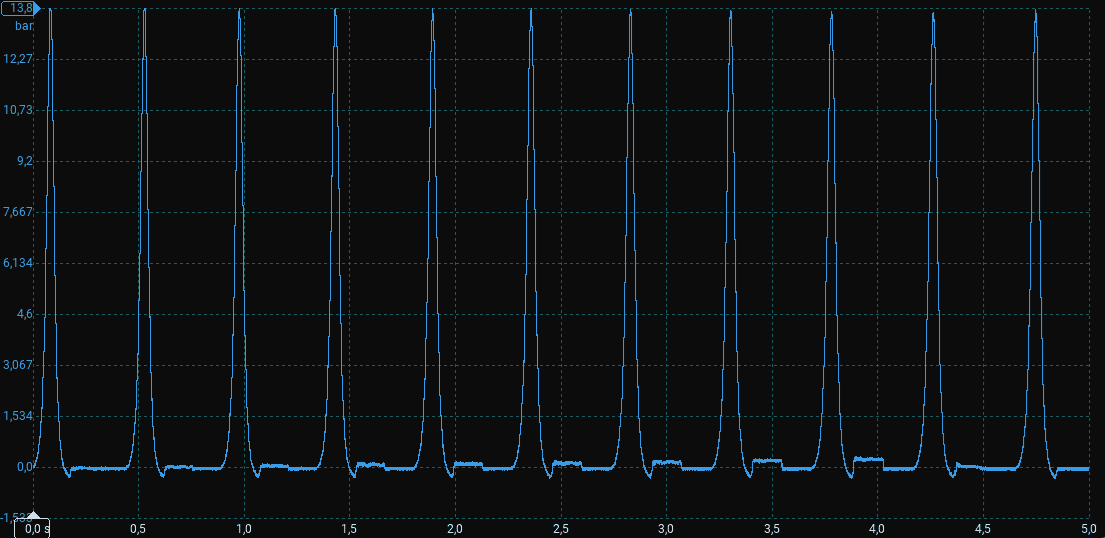
Again, we see during start with an open throttle the compression end pressure on the scope image at each compression stroke. During this experiment, the exhaust gas flow is blocked. This creates higher back pressure in the exhaust – and thus also in the cylinder during the exhaust stroke. The pressure peaks are seen in scope image 1 from t = 0.5 s. Here, we already see a slight increase in the back pressure begin. This back pressure continues to rise until t = 4 s. From that point, the blockage in the exhaust is removed.
Practical examples of a restriction in the exhaust can result from:
- Worn exhaust cams resulting in minimal valve lift;
- Valve clearance is adjusted too loose, causing the exhaust valve to open too briefly;
- Incorrect timing of the exhaust camshaft, while the intake camshaft is correctly timed (otherwise no good compression pressure can develop);
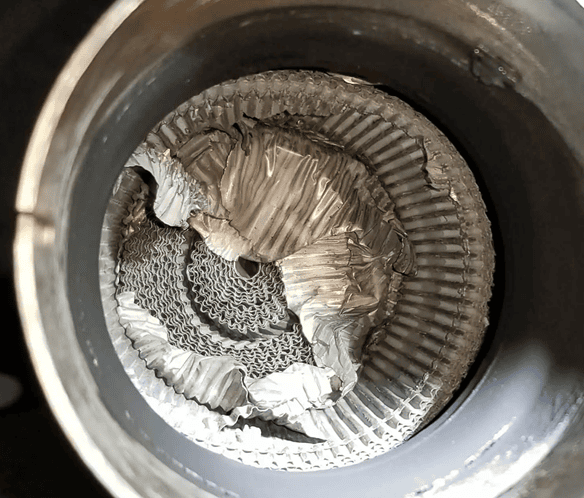
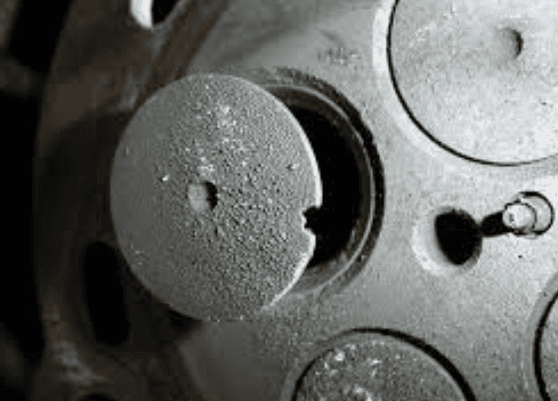
- Faulty catalytic converter, partially or fully obstructing exhaust gas flow (see the image);
- Partly dislodged internal elements in a muffler;
- Crushed muffler or kinked exhaust as a result of a collision;
- Seized exhaust brake valve in heavy diesel engines;
- A defective turbo where exhaust gases cannot exit via the turbine wheel or wastegate, or a combination of both.