Introduction:
The cooling process in a car’s air conditioning system uses changes of state of a substance. During a change of state, such as the transition from liquid to vapor, the molecular structure of the substance changes, which requires heat. Heat is absorbed when liquid changes into vapor, and in the opposite case, during the transition from vapor to liquid, heat is released.
If we look at the heat transfer to and from the surroundings, we see that during the evaporation process the surroundings cool down, while during condensation heat is released and the surroundings warm up. This cooling of the surroundings occurs in the evaporator, while warming takes place in the condenser. This process repeats continuously, which is why it is known as a cycle process.
On the page “Air conditioning introduction” the cycle process is described in a practical way, including the different air conditioning components. On this page, we will take a closer look at this cycle process using the log pH diagram.
Cycle process:
Before we show a complete log-pH diagram, we will first start with the air conditioning cycle process. In this cycle process we use the diagram of the refrigerant R134a. In this diagram, the regions for gas, gas-liquid, and liquid are distinguished from each other. The critical point is located at the top, at 101 degrees Celsius and a pressure of 40 bar. These are the maximum temperature and pressure at which the refrigerant is chemically stable. On the x-axis, the heat content (enthalpy) is plotted against pressure. Although we often speak of a “pH diagram,” it is actually a “log-pH diagram” because of the logarithmic scale.
- At point 1 in the diagram, the compressor starts, drawing in refrigerant from the evaporator. The pressure is 2 bar;
- The gas is compressed from 1 to 2, increasing the pressure and heat content. The pressure and temperature rise to 15 bar and 70 degrees Celsius. The gas becomes superheated;
- Due to heat being released in the condenser, the heat content decreases and initially the temperature as well. Between point 2 and 3 the gas loses its superheat, causing the temperature to drop here from 70 to 55 °C.
- From point 3 to 4, heat is released at a constant temperature. Here the gas is converted into liquid. The pressure remains constant;
- Due to further cooling, the liquid is slightly subcooled (from 4 to 5). The subcooled liquid under the high pressure of 15 bar reaches a restriction at point 5: the capillary tube or expansion valve. Here the high pressure is separated from the low pressure. From the compressor’s point of view, we can also say that the discharge pressure is separated from the suction pressure.
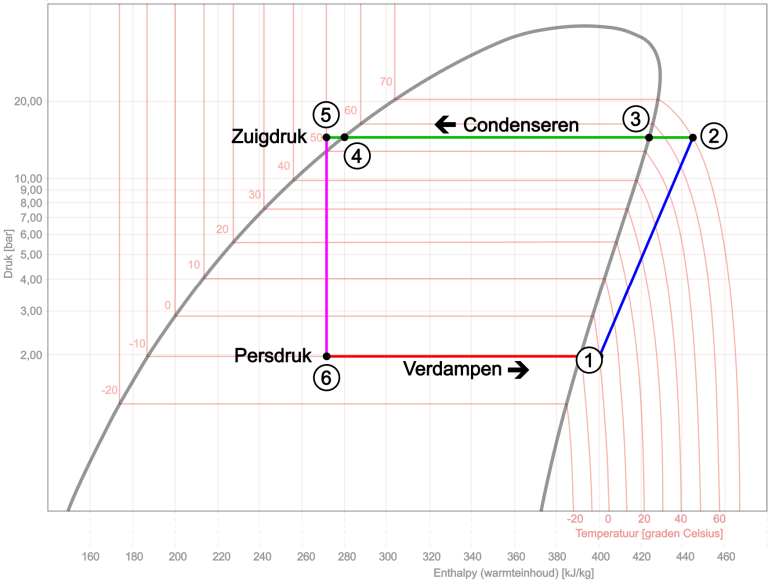
Due to the sudden pressure drop at the restriction, the boiling point of the refrigerant in the liquid phase will become lower, causing spontaneous evaporation. The heat required for this is first taken from the refrigerant itself and its immediate surroundings. In this process the heat content remains virtually constant. Then, from point 6 to 1, complete evaporation takes place in the evaporator. The boiling temperature of the refrigerant drops between point 5 and 6 from 50°C to -10°C, and eventually warms up as a gas to 0°C by the time it reaches point 1. The heat content of the refrigerant increases, with the required heat taken from the surroundings, in this case the air passing through the evaporator. Pressure and temperature remain virtually constant. As a vapor, the refrigerant leaves the evaporator and is drawn in again by the compressor at point 1. The process repeats.
Log pH diagram:
In the previous paragraph, the log pH diagram was shown, including the cycle process (from evaporating to condensing the refrigerant). The image below shows the state of the refrigerant at a certain pressure in relation to the enthalpy (heat content), with the cycle process indicated by the dark blue line.
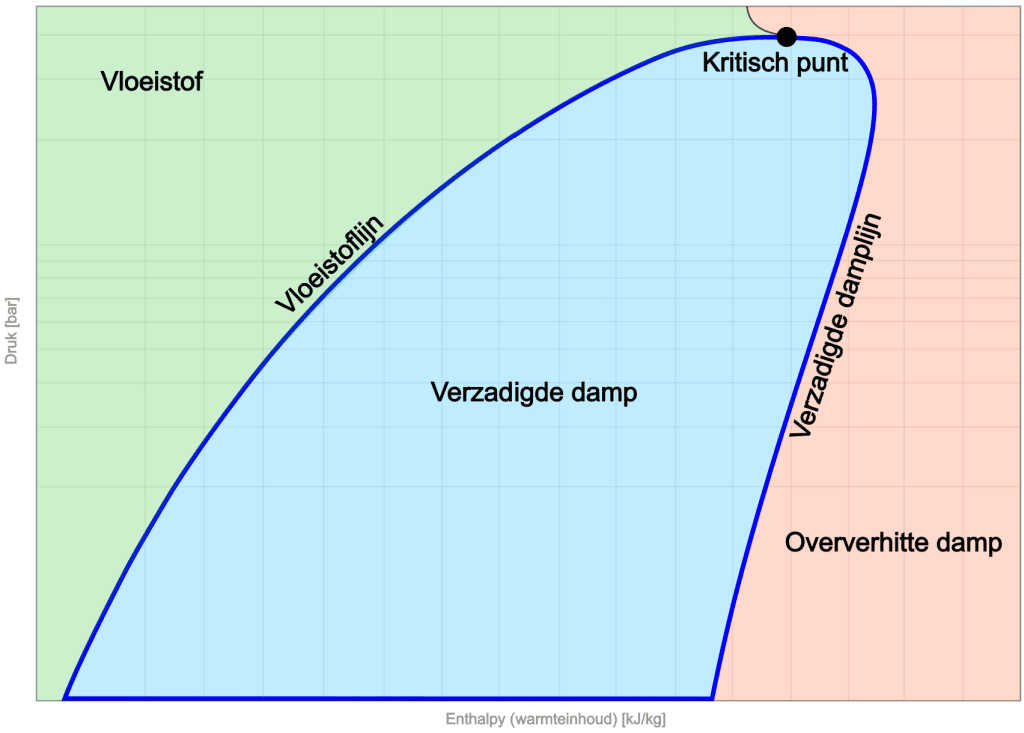
On the left side of the diagram is the liquid region. At low enthalpy, the refrigerant is in liquid form. As enthalpy increases, the saturated liquid line is reached. The slope of this line indicates the changes in pressure and enthalpy for the liquid phase.
In the middle of the diagram is the saturated vapor region. Here, the refrigerant is in thermal equilibrium, with both liquid and vapor present.
On the right side we see the saturated vapor line, which marks the boundary where the refrigerant has fully evaporated and is in a superheated vapor phase.
At the top of the diagram is the critical point, which indicates the boundary between liquid and vapor. Here the distinction between the vapor and liquid phases disappears, placing the refrigerant in a unique state. There is no clear transition between liquid and vapor.
To provide more insight into the log pH diagram, several curves are added to the diagram below: the isentrope, isotherm, isochore, and vapor quality. In the drawing below, we again see the cycle process (colored gray) along with the course of the other processes. Below is a brief explanation for each change of state:
Isentrope: the isentropic line is characterized by constant entropy. This means that during a process along this line, the refrigerant has no heat exchange with the surroundings and undergoes no change in entropy. It is an efficient adiabatic (without heat exchange) process line in the diagram.
Isotherm: An isothermal line in the log-pH diagram represents a constant-temperature process. During this process, the temperature of the refrigerant remains constant, which means heat is added or removed to keep the pressure-enthalpy (pH) relationship consistent.
Isochore: An isochoric line in the log-pH diagram represents a constant-volume process. During this process, the specific volume of the refrigerant remains constant, meaning no change in volume occurs. As a result, the line can rise steeply up or down in the diagram, depending on other changes such as pressure and enthalpy.
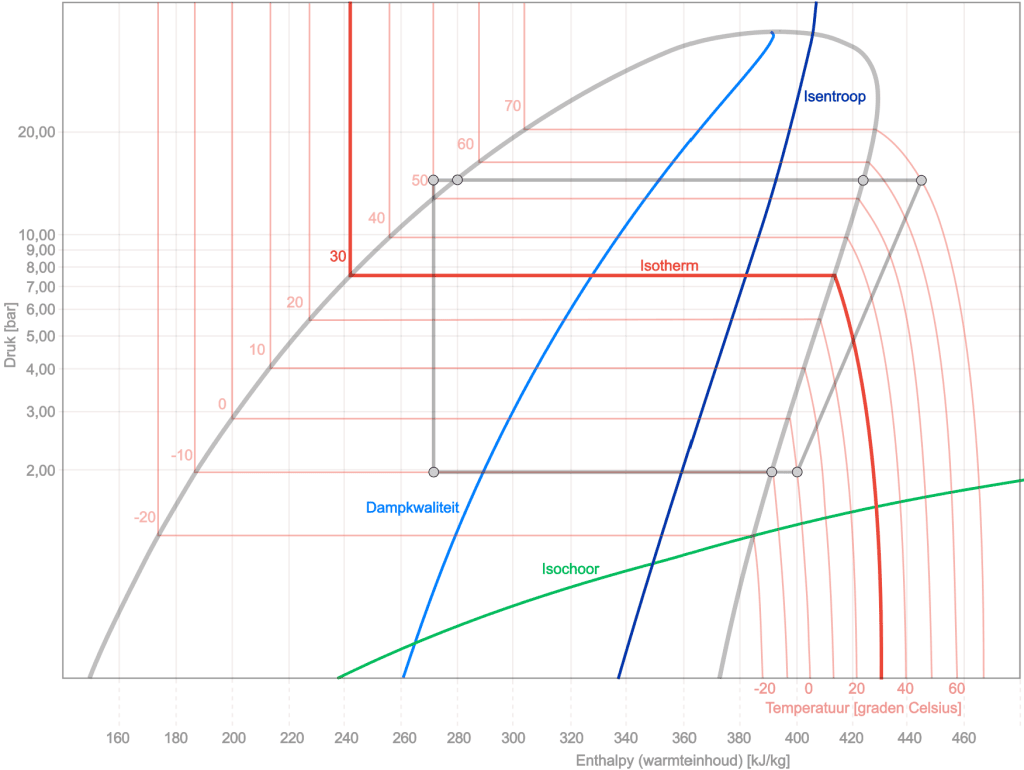
- Vapor quality: In a log-pH diagram of a refrigerant, the x-axis indicates the quality range, from “x=0” (completely liquid) to “x=1” (completely gaseous). Between these extremes, the refrigerant is in a two-phase state, where the x value indicates the ratio of gas to liquid. A line from “x=0,10” to “x=0,90” in the diagram indicates that the refrigerant is within this two-phase range, with the specific x value indicating the distribution between gas and liquid. This is crucial for understanding refrigerant behavior in applications such as refrigeration and air conditioning systems.
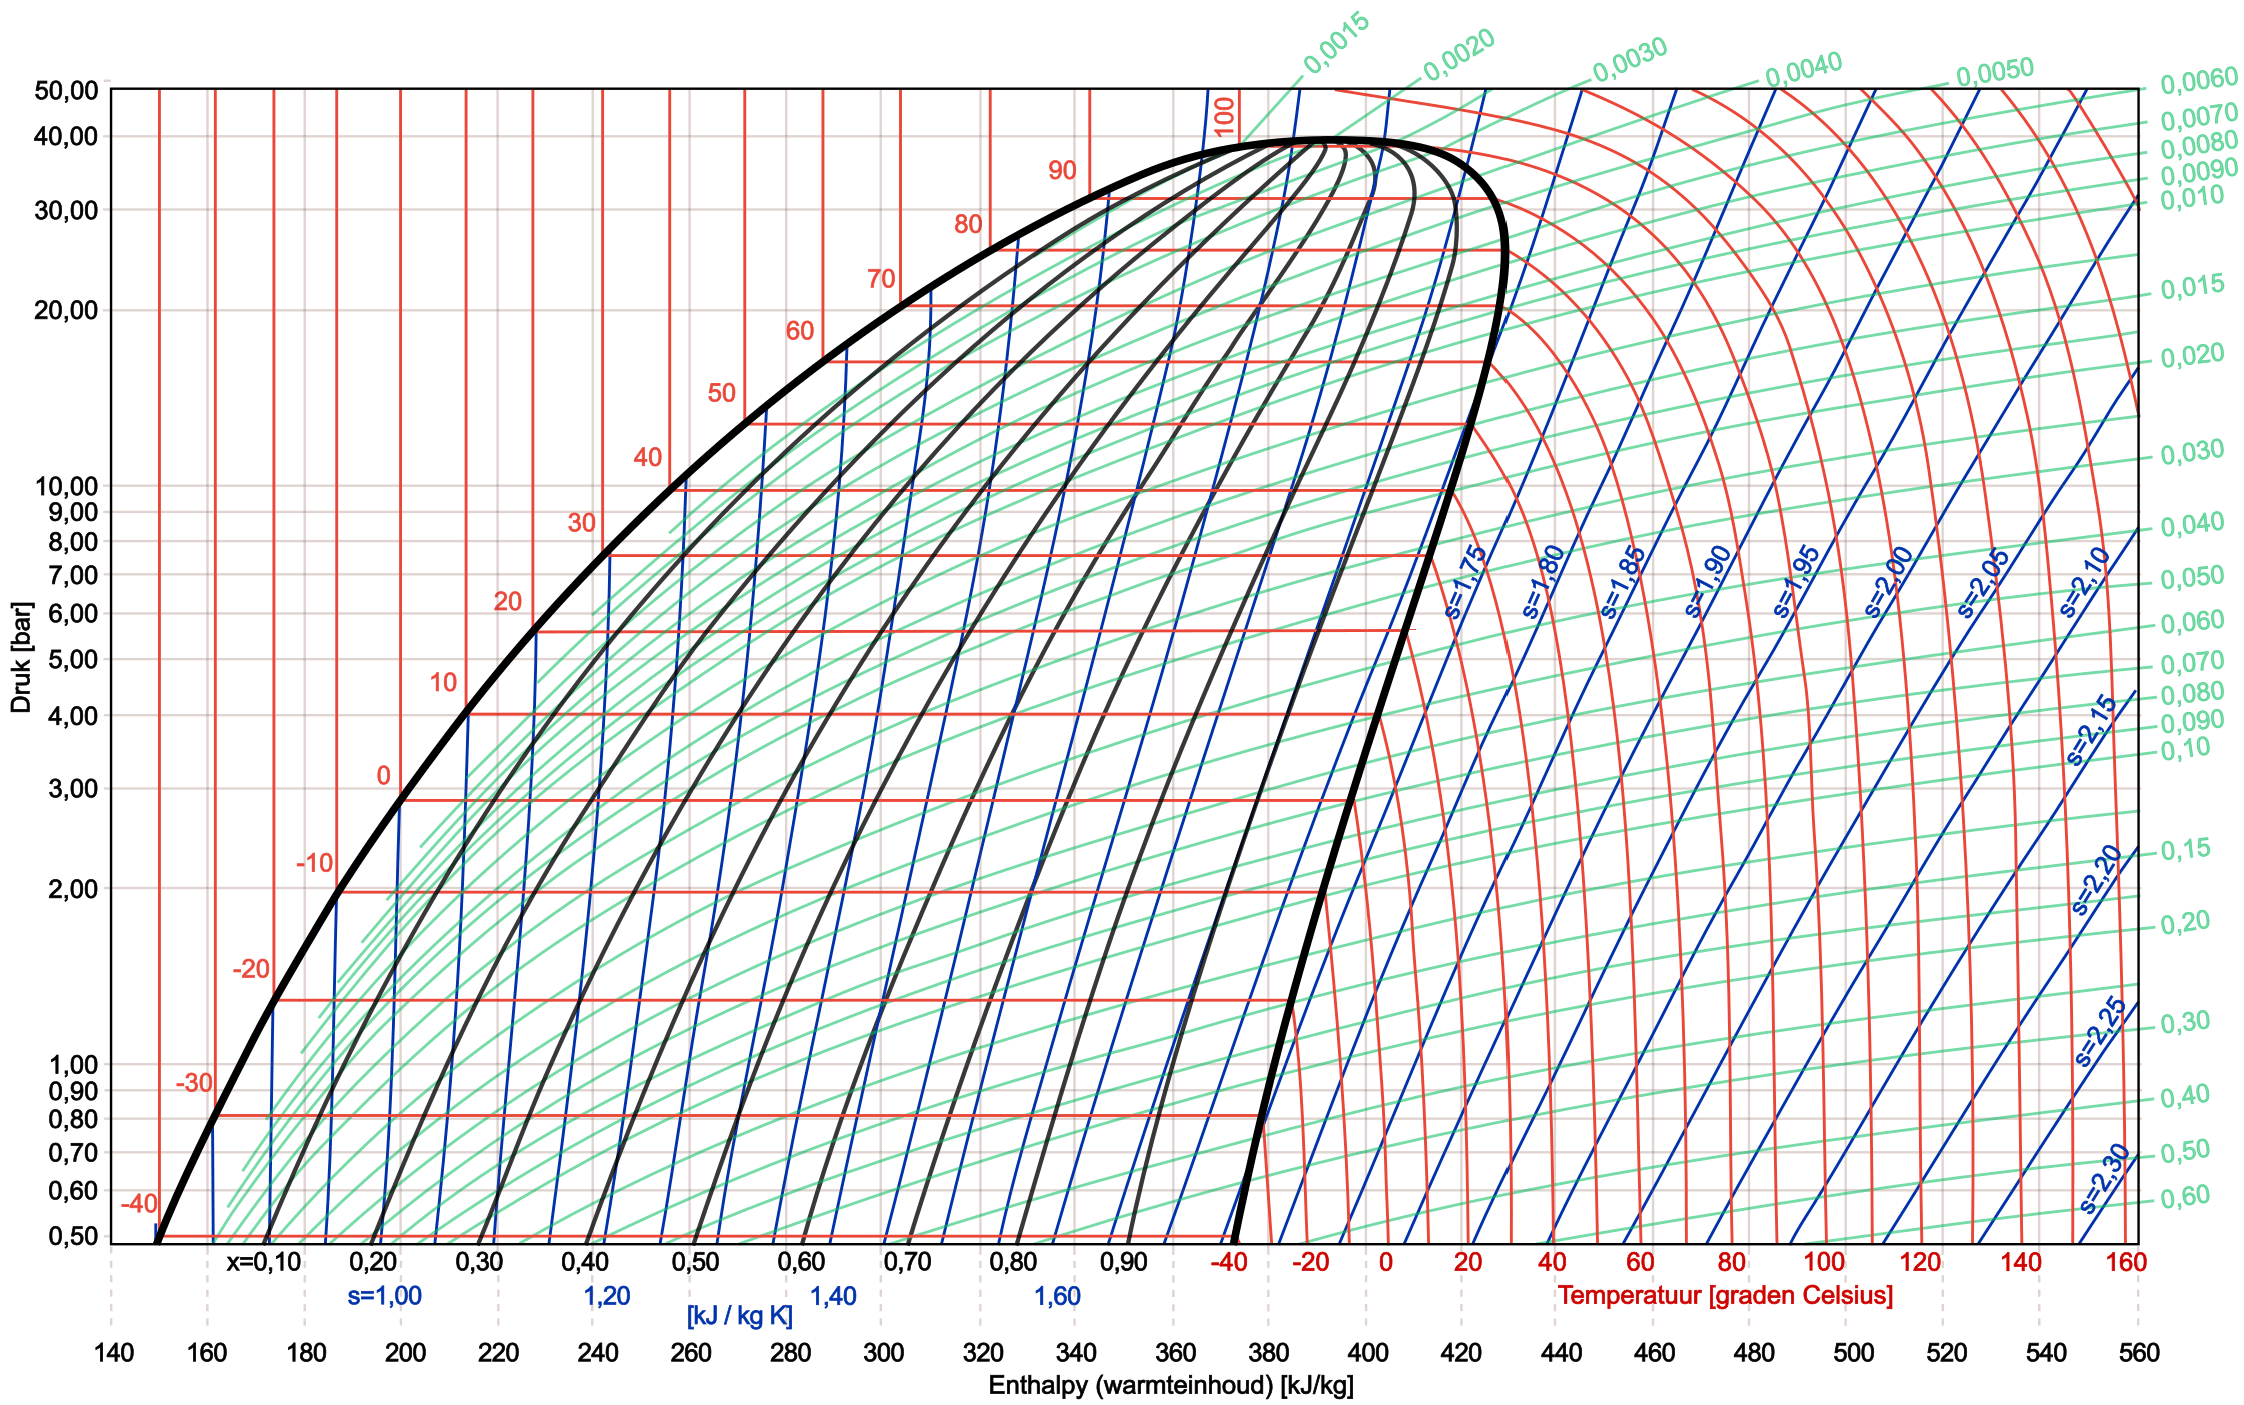
In the image below we see a complete log pH diagram of the refrigerant R134a.
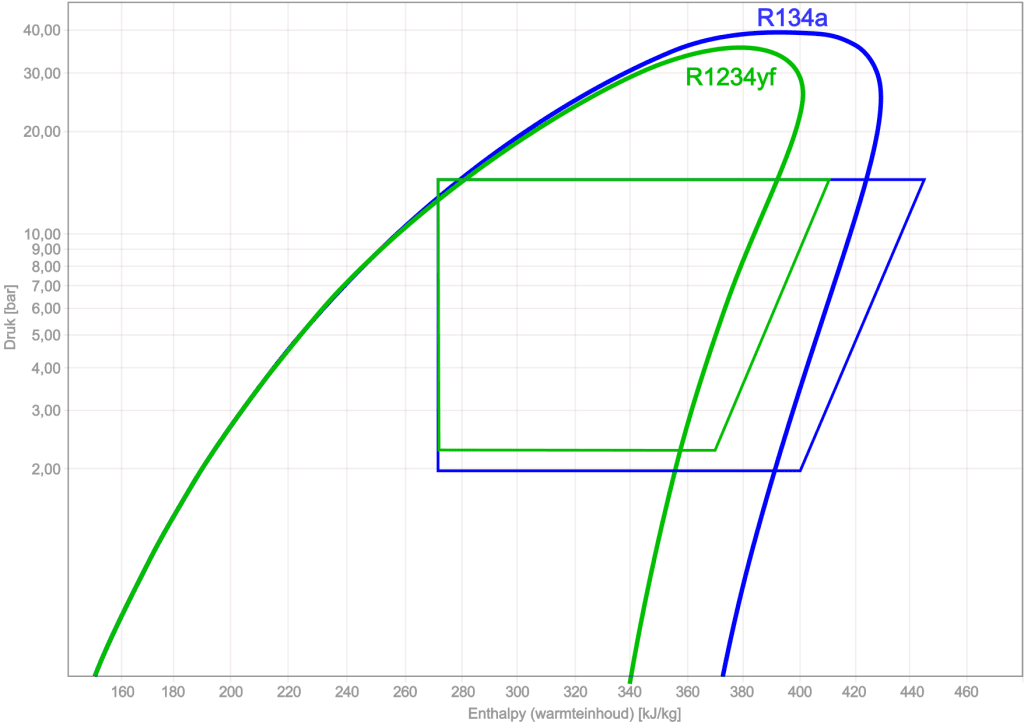
Comparing R134a with R1234yf:
Using the log pH diagram, different types of refrigerants can be compared. The following image shows the log pH diagrams and the cycle processes of R134a and R1234yf.
Related page: