Subject:
- Sankey diagram
Sankey diagram:
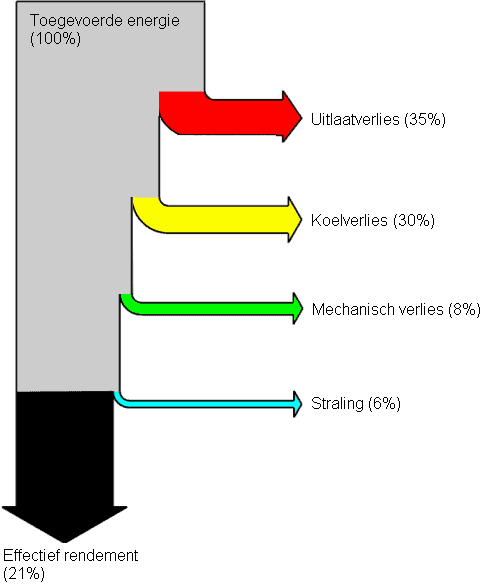
In the Sankey diagram (also called the "Heat balance diagram") the energy losses of the combustion engine can be shown. The Sankey diagram arises (and is calculated) from the Seiliger process.
The fuel supplied to the combustion engine is mixed with air and ignited. Not all the energy from the combustion is used to power the engine (and the wheels). More than half of the combustion energy is lost to:
- Drive losses (think of the drive of the coolant pump, air conditioning pump, distribution and other mechanical components)
- Gear losses (conversion of a translational movement of the piston to a rotational movement of the crankshaft)
- Heat losses (heat from combustion is lost to radiation and reflection to the engine parts)
The useful energy that remains is called the effective efficiency.
The image shows the Sankey diagram. The diagram shows that 35% of the fuel is lost in heat from the exhaust gas, as well as the 30% cooling loss (heat lost to the coolant), 8% mechanical loss (drive and transmission losses) and 6% to radiation.
This diagram is of a gasoline engine. A petrol engine has a relatively low efficiency of around 21%. This means that only 21% of a liter of fuel is used to “drive”. A diesel engine has a higher efficiency (up to 35%). Here, for example, the cooling losses and the radiation are less, but the mechanical loss is again somewhat higher. So a diesel engine has a different Sankey diagram than a petrol engine.
In order to, for example, reduce the cooling losses as an engine manufacturer, it is possible to opt for a coolant pump with an adjustable speed (also switched off if necessary) or to use several cooling circuits. Due to a modified design, it can be ensured that less coolant flows along the cylinder walls, and as a result less heat is absorbed by the coolant.
By using an exhaust gas turbo, the exhaust gas losses can be reduced. The effective return increases. With a mechanical compressor, the mechanical loss increases (an additional component has to be driven), but the effective efficiency increases faster. For example, of the 5% additional mechanical loss, the effective efficiency is increased by 10%.
Related page: