Subjects:
- Comparison theoretical and real labor process
- Indicator diagram
- Pressure course during the four-stroke process of a petrol engine
- Pressure course during the four-stroke process of a diesel engine
- Pressure course during varying operating conditions
- Flow Loss
- Influence ignition timing on indicator diagram
- Pressure course in the p-α diagram
- Peak gas pressure
- Average gas pressure
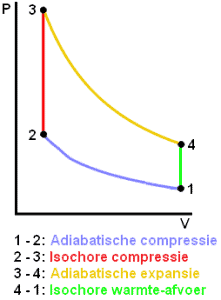
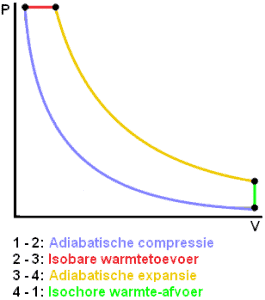
Comparison theoretical and real labor process:
In a work process of a petrol or diesel engine, we are dealing with a PV diagram (P = pressure, V = volume) that shows the relationship between the pressure and the volume in the four-stroke process. More information about this can be found on the page: Seiliger process.
The theoretical loop process takes place in an ideal engine, in which no residual gases or losses are present. In reality, the theoretical labor process differs from the real labor process because of the following deviations:
- the cylinder contains not only fresh charge, but also residual gas from the previous work cycle;
- incomplete combustion of the fuel;
- combustion does not run exactly at the same volume or pressure;
- heat exchange between the gas and the cylinder wall;
- flow losses occur during the work shift;
- there is always (minimal) gas leakage along the piston rings;
- the specific heat changes with pressure and temperature, which affects combustion.
The course of the actual labor process is recorded with the indicator diagram.
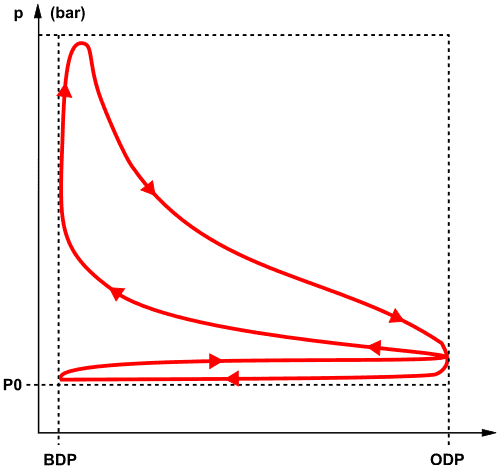
Indicator diagram:
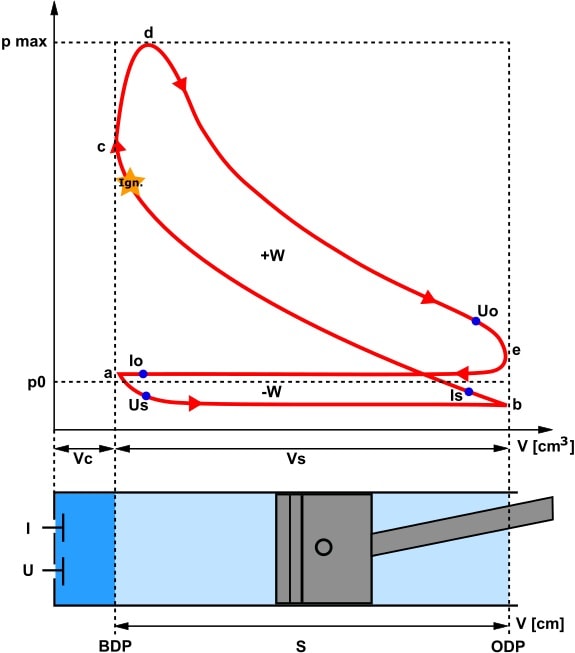
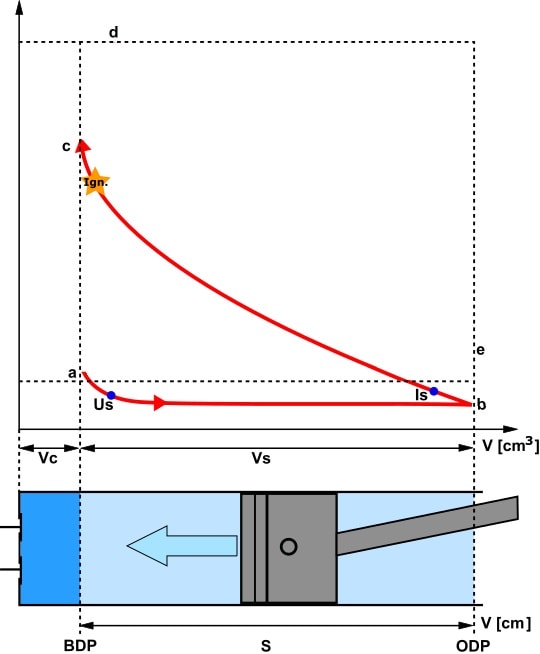
The indicator diagram shows the gas pressure in the cylinder (above the piston) during two crankshaft revolutions. The diagram was established during a pressure measurement taken in the cylinder.
The indicator diagram shown is of a gasoline engine. The red line indicates the pressure profile in relation to the piston stroke. With an actual measurement, a value is obtained at p Max. We'll get into this later. Below the diagram is a cylinder with a piston in it. The letters Vs and Vc indicate stroke volume and compression volume.
Here is a list of abbreviations used in the figure:
- p0: atmospheric air pressure;
- pmax: maximum pressure in cylinder;
- S: piston stroke;
- VS: stroke volume;
- Vc: compression volume;
- W: labor (+ positive and – negative);
- Ign: ignition moment;
- Io: inlet valve opens;
- Us: exhaust valve closes;
- Is: inlet valve closes;
- Uo: exhaust valve opens
Pressure profile during the four-stroke process of a gasoline engine:
We can view the indicator diagram in four different situations:
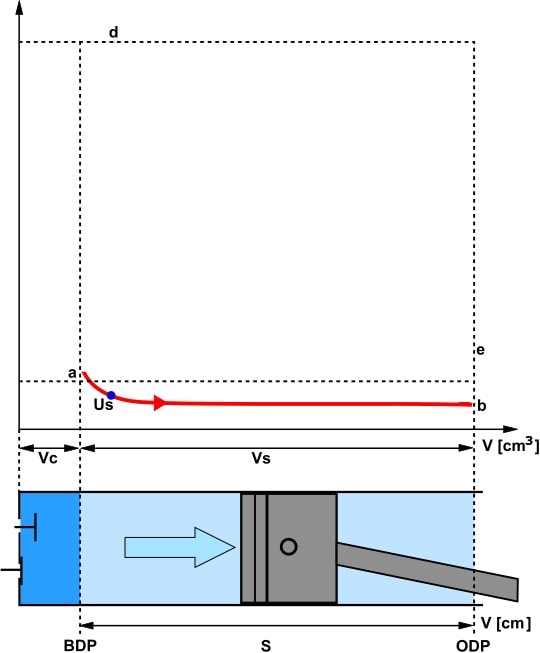
- Intake stroke: The piston moves from TDC to ODP and sucks the air in. The volume increases because the space above the piston becomes larger and larger.
The pressure remains constant*. The red line in the indicator diagram runs from a to b; - Compression stroke: The piston moves up and compresses the air. The air volume decreases while the pressure increases. The red line shows this between the dots b en c. At the end of the compression stroke, ignition takes place;
- Power stroke: After the spark plug sparks, it takes some time for the mixture to burn completely. We see this process between the dots c en d. The force released with the ignition pushes the piston downwards. The volume increases and the pressure decreases. We see this between the letters d en e;
- Exhaust stroke: The exhaust valve opens and the piston pushes the exhaust gases out. The volume decreases, the pressure remains constant (e to a).
Hybrid vehicle manufacturers are increasingly adapting the Atkinson-Miller Principle to reduce mechanical resistance during the compression stroke. This is reflected in the increasing line of the compression stroke in the indicator diagram.
*In the explanation we talk about equal pressure during the intake stroke. This is partly correct. During the intake stroke, piston acceleration is maximum at approximately 60 degrees after TDC. The incoming air cannot follow the piston. At that moment the maximum negative pressure of approximately -0,2 bar is created. The cylinder pressure then rises again. The mass inertia of the incoming air ensures that air still flows into the cylinder while the piston moves upwards again. The magnitude of the underpressure depends on the position of the throttle valve and the speed. A further closed throttle valve provides greater vacuum at a constant engine speed. We have neglected the increased underpressure during maximum piston acceleration in the text and images above.
Pressure profile during the four-stroke process of a diesel engine:
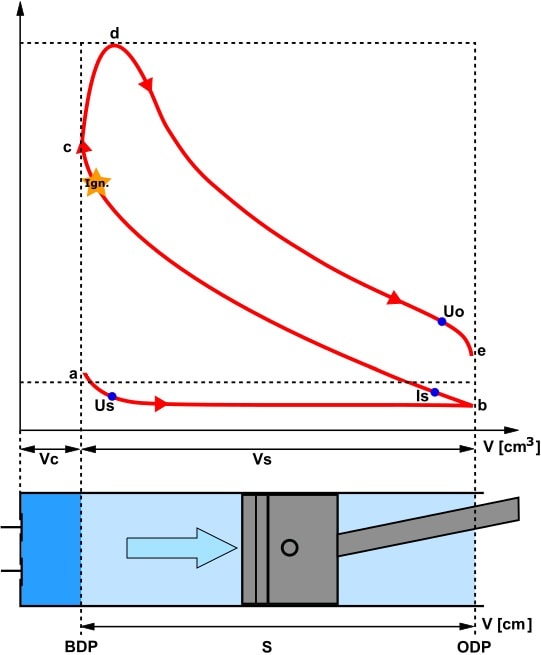
On the right we see an indicator diagram of a diesel engine.
- intake stroke: the piston moves from TDC to ODP and draws in air (if the engine is supercharged);
- compression stroke: the piston moves to the ODP. The air is compressed and the temperature rises to more than 100 degrees Celsius due to the pressure increase. At the end of the compression stroke the diesel fuel is injected. Fuel injection starts 5 to 10 degrees before TDC and ends between 10 and 15 degrees after TDC;
- power stroke: because diesel fuel has been injected at the end of the compression stroke, it starts to burn while the pressure remains constant. The pressure in the (almost) horizontal part remains constant, while the volume increases.
In the power stroke we see the isobaric heat dissipation from the theoretical circuit process.
As with the petrol engine, we see that the exhaust valve opens before the piston has reached TDC. Also valve overlap occurs because the intake valve opens before the exhaust valve closes.
Pressure curve during varying operating conditions:
Besides the engine properties determining the indicator diagram, the operating conditions (read: engine load) also influence this. A high pressure above the piston is not always present or necessary.
The three indicator diagrams below show the pressure profile in relation to the crankshaft degrees. The diagrams are recorded under the following conditions:
- partial load: 3/4 load at n = 4200 rpm;
- full load: at n = 2500 rpm;
- engine braking: at n = 6000 rpm with closed throttle.
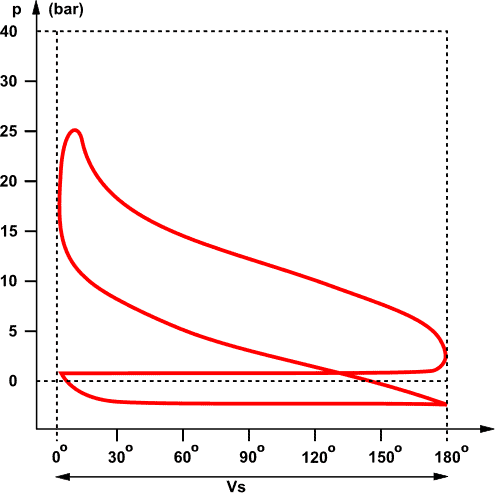
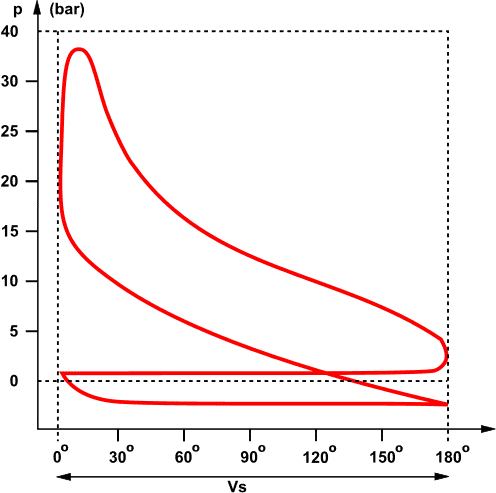
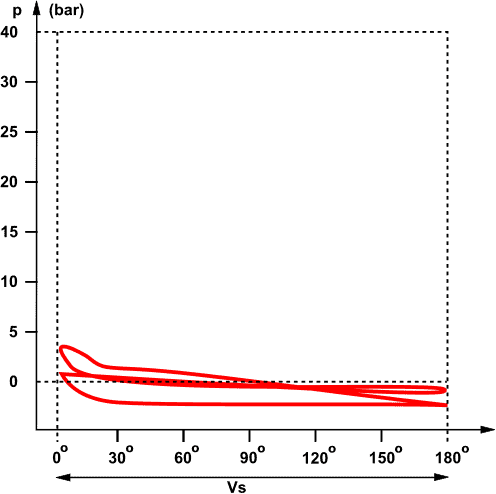
We see differences in the maximum gas pressure in the cylinder between partial load and full load. When “braking on the engine” the throttle is closed and there is a high vacuum in the inlet path and in the cylinder. Due to this underpressure, the compression pressure is not higher than 3 to 4 bar.
Flow Loss:
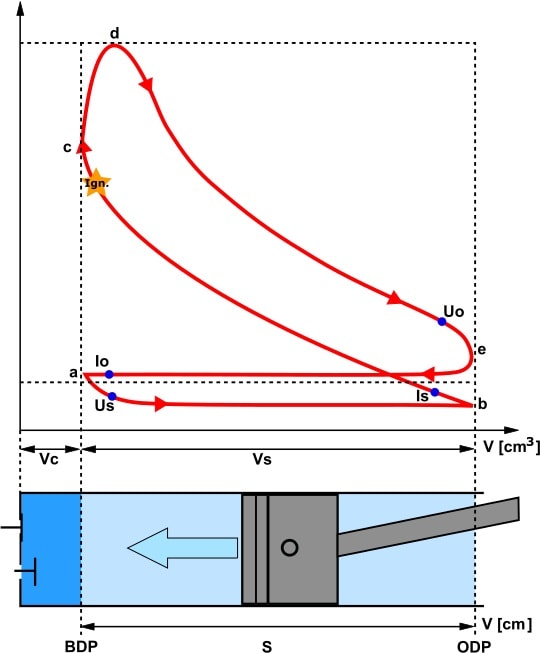
During the intake stroke, a negative pressure is created in the cylinder. Suctioning the air takes energy. This is also reflected in the indicator diagram. Between points a and b the red line drops below p0 (the atmospheric outside air pressure). Below this dotted line there is a vacuum (area -W). We call this flow losses or flushing losses.
The negative work (-W) costs energy and is therefore undesirable. Rinsing takes work. The outlet pressure is higher than the inlet pressure. The coil loop is counterclockwise on self-priming motors.
Manufacturers apply techniques to limit flow losses:
- variable valve timing;
- fast and large valve opening;
- optimal dimensioning of inlet ducts;
- smooth course of the channels in the inlet section (prevention of sharp transitions);
- supercharging (by means of a turbo and/or mechanical compressor.
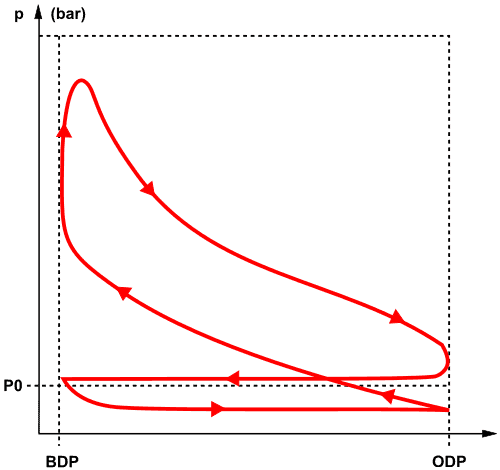
Engines equipped with supercharging have less or no negative trend in the indicator diagram. The coil loop runs clockwise and now produces work. The boost pressure helps to push the piston down (from TDC to ODP) during the intake stroke. The required compressor work is extracted from the exhaust gas, because the compressor wheel of the turbo is driven by the turbine wheel. As a result, supercharged engines are much more efficient under the same conditions compared to self-priming engines.
Influence of ignition timing on indicator diagram:
To achieve the lowest possible fuel consumption and high efficiency, it is important to achieve the following:
- a short combustion time, so a high combustion rate. This has to do with the mixture composition;
- correct phasing of combustion in relation to piston movement. This relates directly to the ignition timing. The center of gravity of the combustion should be approximately 5 to 10 crankshaft degrees after TDC. The center of gravity is the heat release that occurs during combustion.
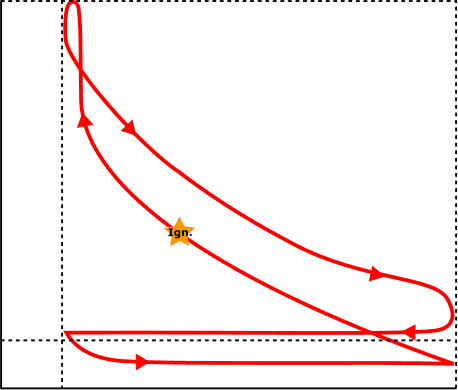
Both an early and too late ignition time leads to an increased heat emission through the cylinder wall and thus a reduction in the quality level.
- Ignition too early: Pressure builds up too early because combustion starts early in the compression stroke. The piston is strongly decelerated before TDC by the combustion pressure. An early ignition leads to high top pressures, resulting in a reduction in mechanical efficiency and the risk of engine failure.
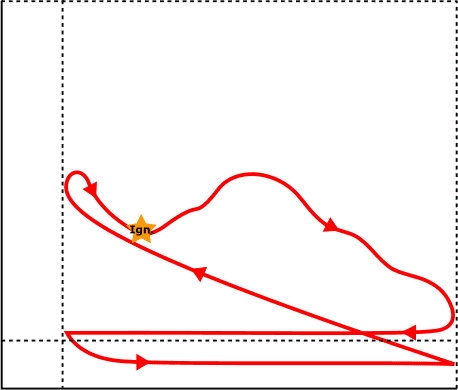
- Ignition too low: Combustion is initiated too late. The piston is already moving towards the ODP, causing the pressure in the expanding space to become insufficiently high. The still burning gases also flowed past the exhaust valves. As a result, the temperature rises too high. A lean mixture gives the same result: the gas burns too slowly. If the mixture is too lean, the gas still burns at the beginning of the intake stroke. For this reason, a kickback can occur in carburettor engines.
A modern engine management system determines the correct ignition time from its characteristics: under all circumstances, the ignition time must be as close as possible to the knock limit.
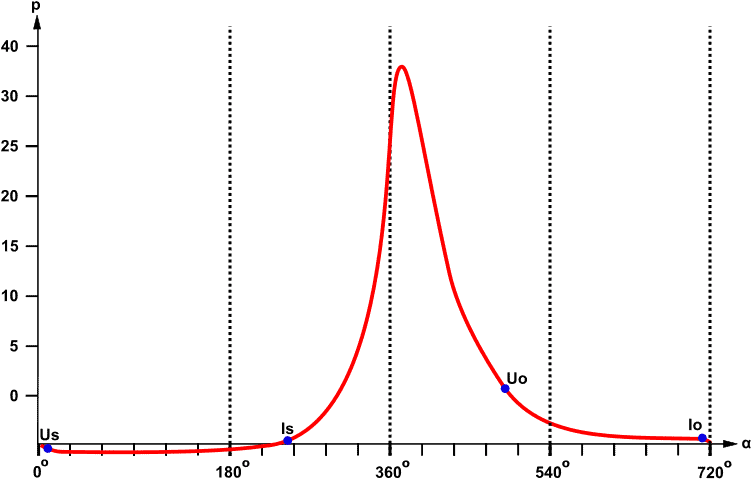
Pressure course in the p-α diagram:
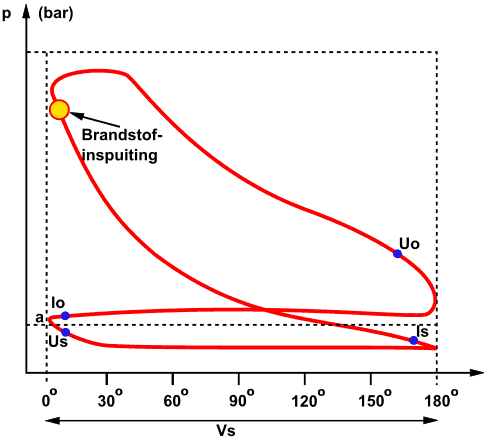
The indicator diagram can be converted to the tangential forces diagram. This shows the tangential force as a function of the crank angle (alpha). We convert the indicator diagram into a diagram in which the pressure (p) as a function of the angle (α) is depicted: the p-α diagram.
In the following image we see the pressure development in the cylinder during full load.
The blue dots indicate, as in the “Indicator diagram” section, when the valves open and close:
- Opening (Io) and closing (Is) intake valves
- Open (Uo) and close (Us) exhaust valves.
In addition, we can see from the crankshaft degrees which stroke the engine is working on:
- 0 degrees: TDC (end of exhaust stroke, start of intake stroke)
- 180 degrees: ODP (end of intake stroke, start of compression stroke)
- 360 degrees: TDC (end of compression stroke, start of power stroke)
- 540 degrees: ODP (end of power stroke, start of exhaust stroke)
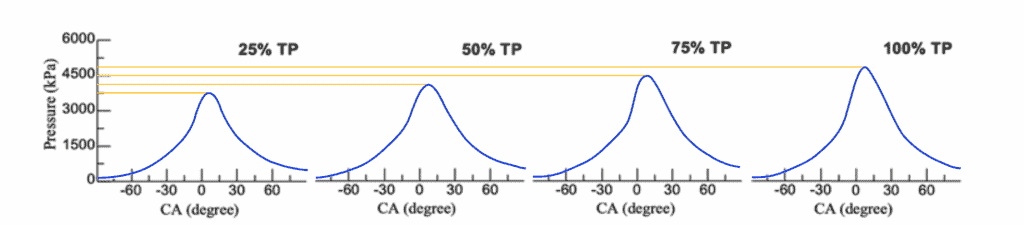
Peak gas pressure:
The peak gas pressure is highest during the power stroke. The level of the pressure depends on the engine load: when the engine delivers a lot of power, the combustion pressure will be higher than at part load.
The four images below show this: the throttle opening TP (Throttle Position) gives an indication of how much the engine is loaded in relation to the crankshaft rotation CA (Crank Angle). With an average petrol engine, a pressure of 4000 kPa is created during combustion in partial load and in this case around 5000 kPa at full load. In engines with stratified injection, camshaft adjustment and variable valve lift, the pressure can rise above 6000 kPa.
Average gas pressure:
During the working process, the pressure in the cylinder varies enormously. During the intake stroke there is a negative pressure (if an exhaust gas turbo provides an increased intake air pressure), and after the compression stroke there is a pressure peak. The higher the peak gas pressure, the more powerful the combustion.
To determine the mean pressure of the combustion process, we can divide the indicator diagram into small rectangles of equal widths. The following image shows blue and green rectangles. By calculating the area of the blue rectangles we can calculate the positive pressure. Then we subtract the area of the green triangles from that. We are then left with the average piston pressure.
With the average piston pressure we can determine, among other things, the indicated and effective power of the engine. Visit the page: assets, losses and returns to read more about this.
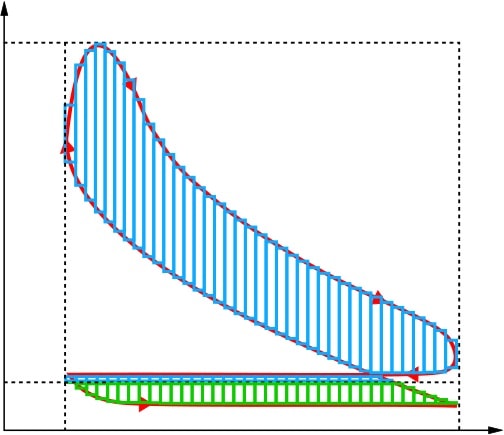
In the picture we see that the red line falls outside the blue rectangles: if we were to make the width of each rectangle smaller and we could place more rectangles next to each other, we get a smaller and smaller deviation. We can apply this ad infinitum. Of course, we're not actually going to do that. By applying mathematical functions we can determine the surface mathematically. We do this with integrate.