Subjects:
- Preface
- Analog Air Mass Meter
- Digital Mass Air Flow Meter
- Read measured values using diagnostic equipment
- Consequences of a defective air mass meter
- Operation of the air mass meter
Preface:
The air mass meter is mounted between the air filter housing and the intake manifold.
All the air drawn in passes through the air mass meter. In an atmospheric engine, the air is sucked in by the underpressure in the cylinders and in an engine equipped with a turbo, the air is sucked in by the compressor wheel. The air mass meter measures the amount of air flowing into the engine. On the basis of this data, the amount of fuel to be injected can be determined with the aid of the map values in the engine control unit.
The air mass meter is available in two versions:
- Analog output signal: the level of the voltage depends on the measured value. This is also called an AM signal (Amplitude Modulation);
- Digital output signal: The electronics in the sensor create a digital signal in the form of a frequency. This FM (Frequency Modulation) signal varies as the air volume increases.
In the following paragraphs, the difference between the analog and digital air mass meters is explained with sample measurements. The last section explains the operation of the mass air flow meter at component level.
Analog Air Mass Meter:
The supply voltage to this sensor is 12 volts. The analog voltage signal of this sensor is generally (depending on brand and type) at:
- Ignition on, no airflow: 0,2 – 1,5 volts.
- Engine idling: 1,5 – 3,0 volts.
- Acceleration with the throttle fully open: max. 4,5 volts.
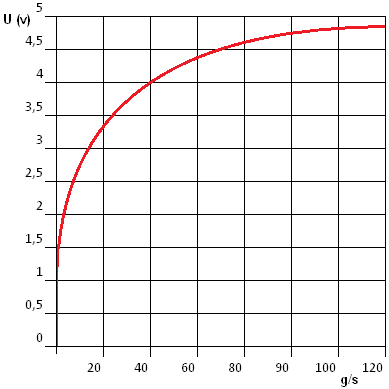
The graph shows the development of the tension in relation to the measured air mass in grams per second. We can measure the voltage with a multimeter.
Digital air mass meter:
The frequency of the signal indicates how much air has passed through the sensor. The voltage of the signal is always between 0 and 5 volts. The frequency indicates how many times the signal repeats within a one second period. When we measure two signals in one second with an oscilloscope, we speak of 2 Hz. In practice we see that the frequency is much higher. In general, manufacturers use the following frequencies:
- stationary: 2 – 2,5 kHz (2000 – 2500 Hz)
- high speed: up to 6 – 6,5 kHz
The frequency increases proportionally with the increasing airflow. If you see deviating peaks in the signal, or if a frequency is measured that is too low at a high speed, there may be a dirty or defective air mass meter. The images below show two measurements of the digital mass air flow meter.
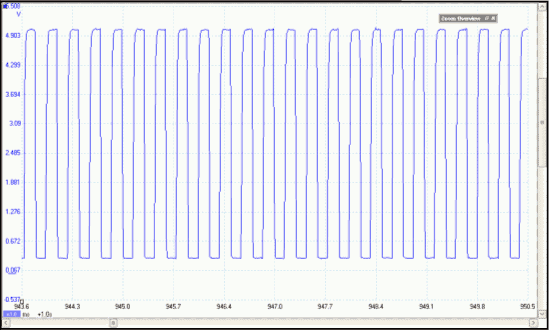
The voltage measurement shows the voltage course with respect to time. In this image it can be seen that the voltage is constantly changing between 0,5 and 4,5 volts. As the airflow increases (when the speed is increased), the time between the ascending and descending lines becomes shorter. The pulses become thinner and closer together. A good diagnosis cannot be made with this scope image.
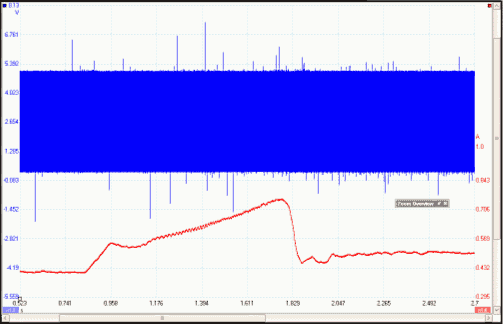
The measurement in which channel A measures the voltage and channel B measures the frequency, gives an idea of the functioning of the air mass meter. Measurements are taken over a longer period of time, making it appear that the blue pulses of channel A are abutting each other. However, this is not so; because of the zooming out, it is hardly possible to distinguish between the rising and falling voltages.
The red line (channel B) indicates the frequency of the signal. The closer the voltage pulses are to each other, the more the red line rises. When accelerating to a high speed with the vehicle with the throttle fully open, the frequency continues to increase until the throttle is released. The height of the red line indicates the maximum frequency of the signal. This data can be compared with the factory data or a calculated value. We will go into this in more detail in the next section.
In the diagram below of a Volkswagen Golf 6 2.0 tdi, the component code G70 indicates the digital air mass meter.
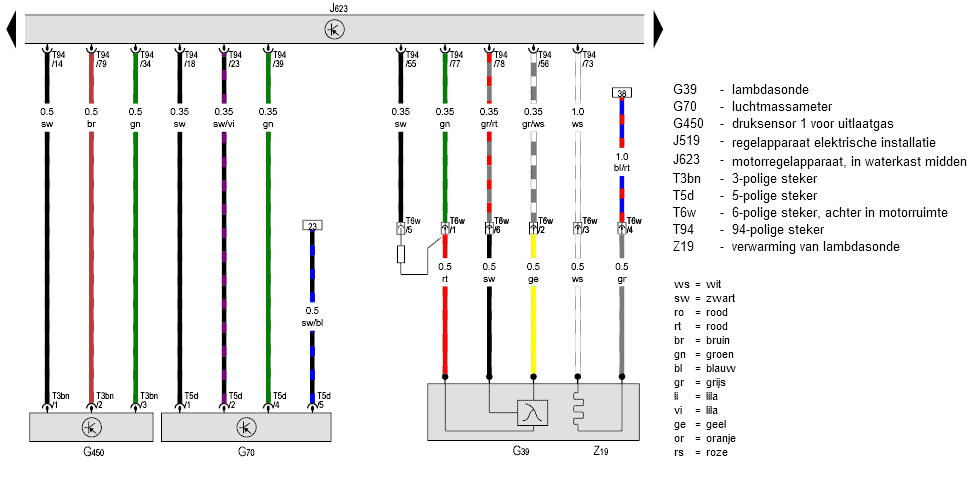
- Pin 1 of the mass air flow meter is connected to pin 18 of the engine ECU. This is the signal wire over which the air mass meter sends the measured value to the ECU;
- Pin 2: signal wire from the air temperature sensor. This sensor is integrated in the mass air flow sensor housing;
- Pin 4: ground;
- Pin 5: is connected to a fuse via reference 23 in the schematic. The air mass meter is supplied with a voltage of 12 volts.
On pin 1 of the air mass meter we can measure the signal that is sent to the ECU. In addition, if there is a breakout box is available, check whether this signal also arrives correctly at pin 18 of the ECU. If these signals differ from each other, we can measure the voltage difference across this wire (pin 1 of the LMM compared to pin 18 of the ECU).
An insufficient supply voltage of the sensor can affect the sensor signal. That is why we should also check the positive and ground connections. We connect the voltmeter or oscilloscope to pins 4 and 5 and check that we are measuring a voltage approximately equal to the battery voltage. If the voltage is too low, we may be dealing with a contact resistance in the plus wire or ground wire that we can detect with the help of the V4 measurement.
Read out measured values using diagnostic equipment:
The engine management system calculates the amount of air based on the sensor value. With the aid of reading equipment, the current amount of air drawn in can be read by means of the live data (also called parameters or measured value blocks). It doesn't matter if the signal is analog or digital; when reading out, the ECU value of the input and processed signal is shown.
To check whether the measured value is correct, it can be compared with the factory data. However, in most cases these are not easy to find. That is why there are calculators to calculate the air volume. A well-known program is the LMM tool which you can download here.
The value calculated by you and the reading value should reasonably match. Of course a small difference is allowed. We always have to deal with the engine characteristics that differ with each engine; think of valve timing, filling degree-increasing techniques such as variable valve timing, a variable intake manifold, etc. However, if these values differ tens of grams, a defect in the air mass meter is not excluded.
The tables below show the calculated values of a naturally aspirated engine with a displacement of 2000 cc (2,0 liters). We start with an idle speed; it is about 800 rpm. There is a vacuum in the intake manifold because the throttle is almost completely closed. The pressure is 0,3 bar. The next two columns show the values at increased engine speed and with a fully open throttle (Wide Open Throttle). The absolute outside air pressure, i.e. 1000 mBar, prevails in the intake manifold. The intake air temperature rises. The engine speed continues to increase to 6000 rpm.
Situation:
- Speed: 800 rpm;
- Intake manifold pressure: 300 mBar;
- Intake air temperature: 20°.
Calculated values:
- 3,86 grams/sec;
- 13,88 kg/hr;
- 0,15 grams per stroke.
Situation:
- Speed: 3000 rpm (WOT);
- Intake manifold pressure: 1000 mBar;
- Intake air temperature: 22°.
Calculated values:
- 47,86 grams/sec;
- 172,31 kg/hr;
- 0,48 grams per stroke.
Situation:
- Speed: 6000 rpm (WOT);
- Intake manifold pressure: 1000 mBar;
- Intake air temperature: 25°.
Calculated values:
- 94,76 grams/sec;
- 341,14 kg/hr;
- 0,48 grams per stroke.
Consequences of a defective air mass meter:
- Less power (doesn't always have to be noticeable)
- Lower top speed
- Higher fuel consumption
- More soot emissions (diesel engine)
- Engine does not rev well at full load, for example
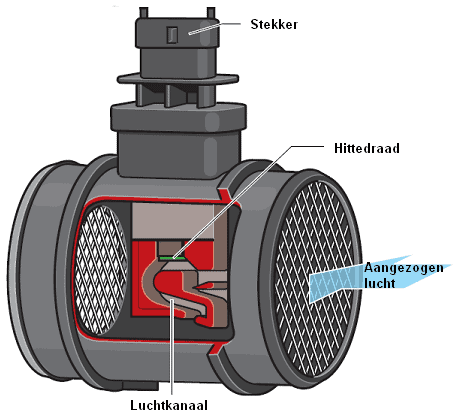
Operation of the air mass meter:
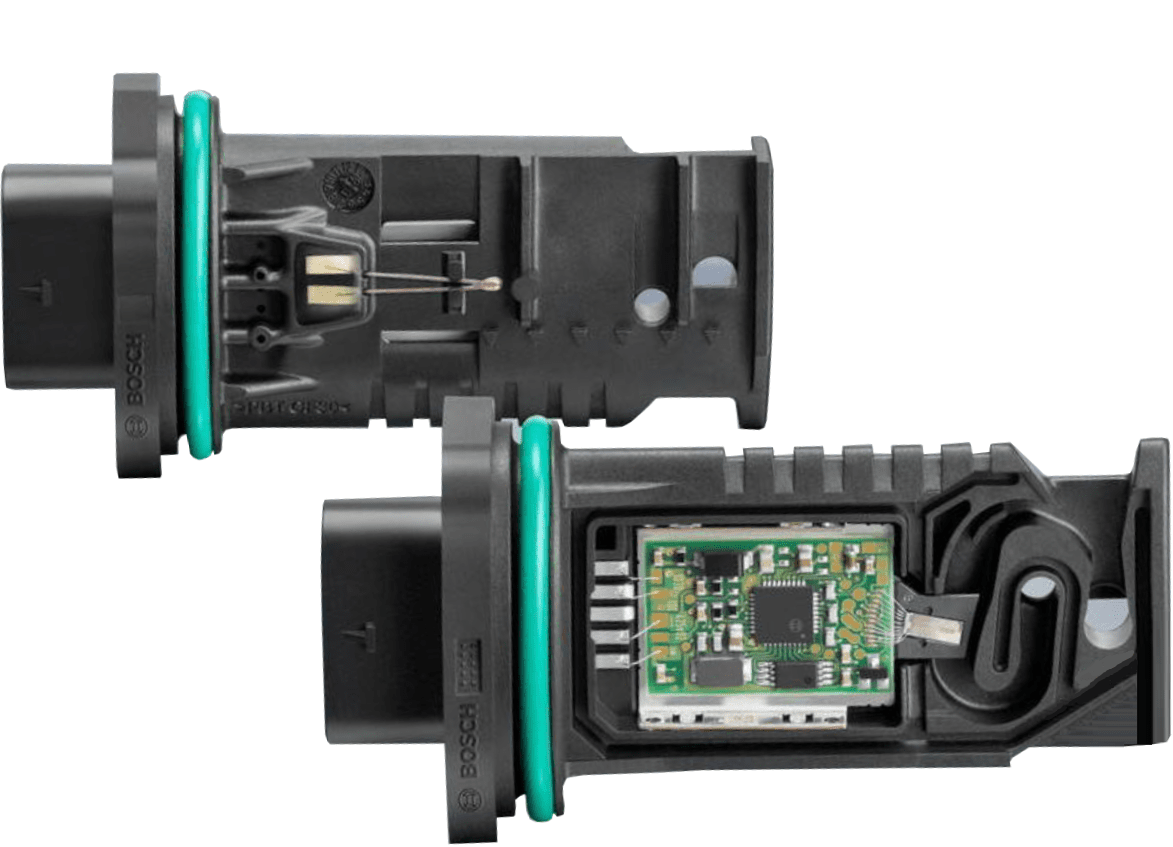
The housing of an air mass meter contains the plug connection for the cable harness to the ECU, the electronics on a circuit board and the measuring element.
The rubber O-ring prevents air from being drawn in along the housing. The measuring element of the air mass meter consists, among other things, of two temperature-dependent resistors (PTC and NTC thermistors).
When the engine is running, the resistors cool down due to the intake air flowing past them. The electronic circuit ensures that the temperature of the PTC heating element remains constant. The voltage difference associated with this is translated by an amplifier circuit into a usable output signal to send to the ECU.
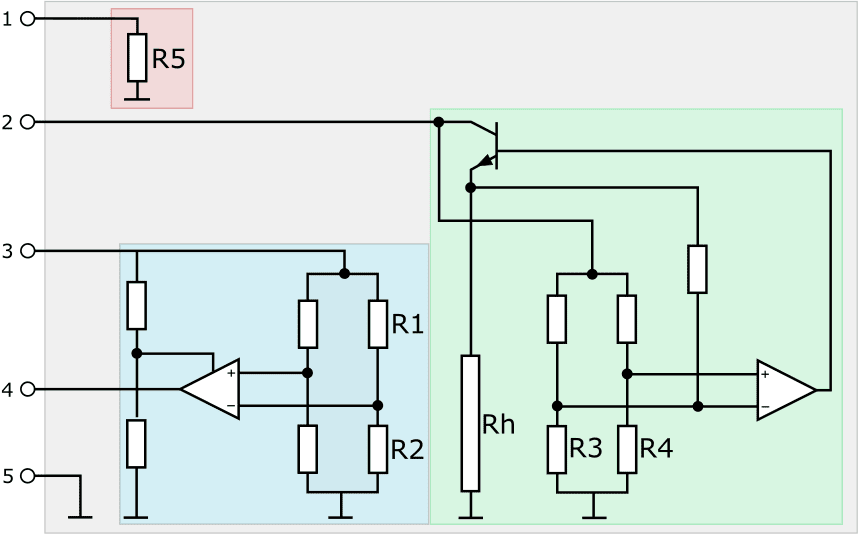
The following figure shows the components in the mass air flow sensor in three sub-areas:
- Red: intake air temperature sensor (NTC);
- Green: hot wire components;
- Blue: components for the measuring element.
The air mass meter has a 5-pin plug connection:
- signal intake air temperature sensor;
- power supply (12 volts) for hot wire;
- power supply (5 volts) for measuring element;
- signal (0,5 – 4,5 volts);
- sensor mass. All internal earths are connected to this output pin.
In the following images, the three sub-areas are shown separately with the explanations next to them.
Intake air temperature sensor: as already mentioned, this sensor is of the type NTC.
The sensor resistance depends on the air temperature that flows from the air filter, via the air mass meter, to the turbo or the intake manifold.
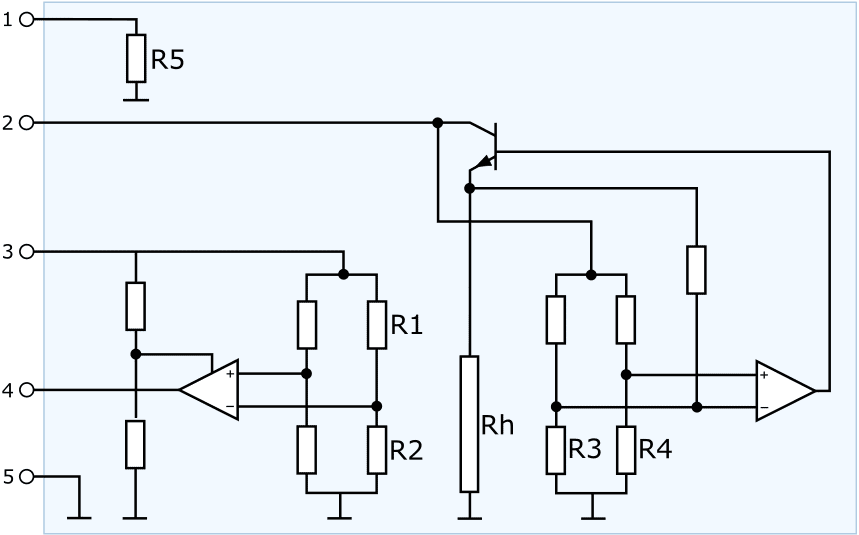
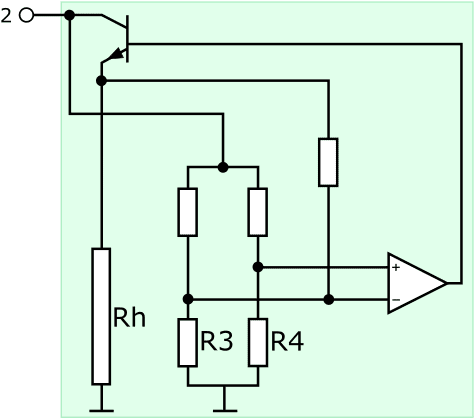
The heat film air mass meter contains a heating resistor which is kept at a constant temperature. In this scheme, the heating resistance is Rh. The heating resistor, also called the hot wire, is switched on and off by a transistor (at the top).
In the middle we see a Wheatstone bridge with resistors R3 and R4 at the bottom. These are temperature dependent resistors (PTC and NTC). The resistors R3 and R4 provide a constant temperature of heating resistance Rh:
- With an increasing airflow, the resistors cool down and a different voltage drop is created across all resistors in the bridge. With Wheatstone's bridge, the resistance change can be converted into a signal voltage for the ECU. See the page “Wheatstone Bridge” for a detailed explanation of this circuit.
- The voltage difference on the opamp changes the output voltage to the transistor;
- The transistor becomes conductive and turns the current supply to the heating resistor Rh on or off;
- The heating resistance will be kept at the same temperature as much as possible by the power supply.
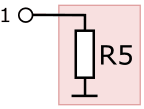
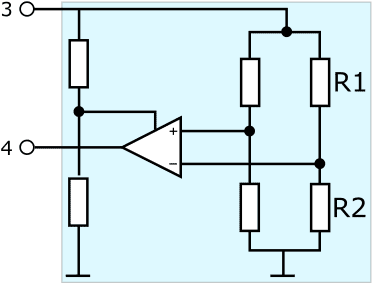
- Temperature dependent resistors R1 and R2 are placed on both sides of heating resistor Rh;
- If no air flows through the sensor, resistors R1 and R2 have the same value and there is no output signal;
- If air does flow through the sensor, resistor R1 cools and R2 is heated;
- As a result, the resistance value of R1 decreases and that of R2 increases;
- Due to the increasing resistance value, the output voltage also increases;
- When the air flows back over the sensor (backflow), R2 cools and R1 is heated, causing the output voltage to drop. The average output voltage is therefore a correct measure for the amount of air mass that flows to the motor.
Backflow is the backflow of air (pulsations) towards the air filter as a result of closing the inlet valves or closing the gas valve. The backflow is measured as extra air mass, which can cause a large deviation in the signal. Modern air mass meters have backflow compensation as outlined in this example with the resistors R1 and R2.